场景:测试目标主机端口是否联通
序言
- 一般情况下,使用
telnet ip port判断端口通不通,其实测试方法不止这一种,还有很多种方法。 - 本文提供的网络可达性测试方法:基于传输层(
host+port)的工作原理
方法1 telnet
telnet是Windows标准服务,可直接用;
如果是Linux机器,需要安装telnet.
用法:
telnet ip port
- 若目标主机的端口不存在/未开放
[root@localhost ~]# telnet 10.0.250.3 80
Trying 10.0.250.3...
telnet: connect to address 10.0.250.3: Connection refused #直接提示连接被拒绝
- 若目标主机的端口存在/已开放
[root@localhost ~]# telnet 127.0.0.1 22
Trying ::1...
Connected to localhost. #看到Connected就连接成功了
Escape character is '^]'.
SSH-2.0-OpenSSH_5.3
a
Protocol mismatch.
Connection closed by foreign host.
方法2 ssh [推荐]
ssh是Linux的标准配置并且最常用,可以用来判断端口吗?
用法:
ssh -v -p port username@ip
-v调试模式(会打印日志).-p指定端口
安装:
- 若目标主机的端口不存在/未开放
apk add openssh

[root@localhost ~]# ssh 10.0.250.3 -p 80
ssh: connect to host 10.0.250.3 port 80: Connection refused
[root@localhost ~]# ssh 10.0.250.3 -p 80 -v
OpenSSH_5.3p1, OpenSSL 1.0.1e-fips 11 Feb 2013
debug1: Reading configuration data /etc/ssh/ssh_config
debug1: Applying options for *
debug1: Connecting to 10.0.250.3 [10.0.250.3] port 80.
debug1: connect to address 10.0.250.3 port 80: Connection refused
ssh: connect to host 10.0.250.3 port 80: Connection refused
- 若目标主机的端口存在/已开放
[root@localhost ~]# ssh -v -p 1521 xx.yy.hh.mm
OpenSSH_.p, OpenSSL ..e-fips Feb
debug: Reading configuration data /etc/ssh/ssh_config
debug: Applying options for *
debug: Connecting to ... [...] port .
debug: Connection established.
debug: permanently_set_uid: /
debug: identity file /root/.ssh/identity type -
debug: identity file /root/.ssh/identity-cert type -
debug: identity file /root/.ssh/id_rsa type -
debug: identity file /root/.ssh/id_rsa-cert type -
debug: identity file /root/.ssh/id_dsa type -
debug: identity file /root/.ssh/id_dsa-cert type -
方法3 wget
wget是Linux下的下载工具,需要先安装
用法:
wget ip:port
- 若目标主机的端口不存在/未开放
[root@localhost ~]$ wget 172.yy.gg.87:81
--2021-04-07 19:40:17--  http://172.yy.gg.87:81/
正在连接 172.16.yy.gg:81... 失败:拒绝连接。
- 若目标主机的端口存在/已开放
[root@localhost ~]$ wget 172.yy.gg.87:80
--2021-04-07 19:39:25--  http://172.yy.gg.87/
正在连接 172.16.yy.gg:80... 已连接。
已发出 HTTP 请求,正在等待回应... 403 Forbidden
2021-04-07 19:39:25 错误 403:Forbidden。
方法4 nmap
使用端口扫描工具————nmap
可参见: [网络/Linux]网络嗅探工具——nmap - 博客园/千千寰宇
用法:
nmap -p port host
- 若目标主机的端口不存在/未开放
[root@localhost ~]nmap -p 81 172.yy.gg.87:80

Starting Nmap 6.40 ( http://nmap.org ) at 2021-04-07 19:46 CST
mass_dns: warning: Unable to determine any DNS servers. Reverse DNS is disabled. Try using --system-dns or specify valid servers with --dns-servers
Nmap scan report for sdc87 (172.yy.gg.87:80)
Host is up (0.00022s latency).
PORT   STATE  SERVICE
81/tcp closed hosts2-ns

Nmap done: 1 IP address (1 host up) scanned in 0.03 seconds
- 若目标主机的端口存在/已开放
[root@localhost ~]$ nmap -p 80 172.yy.gg.87:80

Starting Nmap 6.40 ( http://nmap.org ) at 2021-04-07 19:46 CST
mass_dns: warning: Unable to determine any DNS servers. Reverse DNS is disabled. Try using --system-dns or specify valid servers with --dns-servers
Nmap scan report for sdc87 (172.yy.gg.87)
Host is up (0.00029s latency).
PORT   STATE SERVICE
80/tcp open  http

Nmap done: 1 IP address (1 host up) scanned in 0.03 seconds
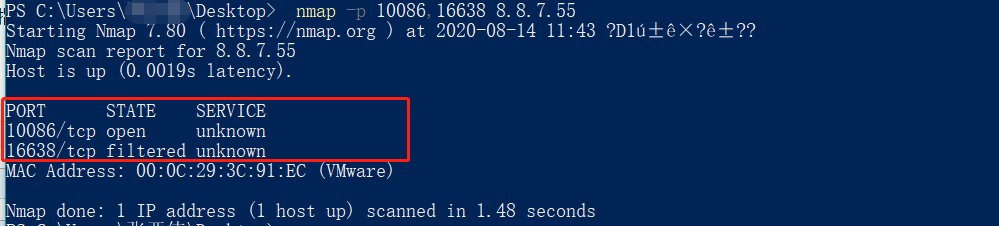
【补充案例】扫描指定端口是否开放
默认扫描端口,1-10000的端口,大于10000的端口无法扫描出来
nmap -p 0-20000  8.8.7.55
  # 探测服务器的0-20000端口范围,则能把大于10000的端口扫描出来了

nmap -p 10086,16638 8.8.7.55
  # 使用-p参数探测10086、16388端口(指定查一个或者多个端口的状态)
方法5 curl
- 若目标主机的端口存在/已开放
[root@vmw-b ~]# curl -v http://192.168.43.153:445
* About to connect() to 192.168.43.153 port 445 (#0)
*   Trying 192.168.43.153...
* Connected to 192.168.43.153 (192.168.43.153) port 445 (#0)
> GET / HTTP/1.1
> User-Agent: curl/7.29.0
> Host: 192.168.43.153:445
> Accept: */*
>
* Recv failure: Connection reset by peer
* Closing connection 0
curl: (56) Recv failure: Connection reset by peer
- 若目标主机的端口不存在/未开放
[root@vmw-b ~]# curl -v http://192.168.43.153:1445
* About to connect() to 192.168.43.153 port 1445 (#0)
*   Trying 192.168.43.153...
* 拒绝连接
* Failed connect to 192.168.43.153:1445; 拒绝连接
* Closing connection 0
curl: (7) Failed connect to 192.168.43.153:1445; 拒绝连接
ping : 网络可达性测验专用工具之ping
序: ping
- 最近搭建的一套数据库集群,因网络环境的变化,需要考虑DNS、主机所处网络等因素,探测网络连通性。
- ping 命令,其实大家都很熟悉,借此,总结一二,以供当前及日后按需翻阅。
尤其是一些响应细节、或特殊参数的使用
概述: ping
- Linux系统的
ping命令是常用的网络命令,它通常用来测试本主机与目标主机的连通性。
我们经常会说“ping一下某机器,看是不是开着”、不能打开网页时会说“你先ping网关地址192.168.1.1试试”。
它通过发送ICMP ECHO_REQUEST数据包到网络主机(send ICMP ECHO_REQUEST to network hosts),并显示响应情况。
这样我们就可以根据它输出的信息来确定目标主机是否可访问(但这不是绝对的)。
- ping命令用于:确定网络和各外部主机的状态;跟踪和隔离硬件和软件问题;测试、评估和管理网络。
如果主机正在运行并连在网上,它就对回送信号进行响应。
每个回送信号请求包含一个网际协议(IP)和 ICMP 头,后面紧跟一个 tim 结构,以及来填写这个信息包的足够的字节。
缺省情况是连续发送回送信号请求直到接收到中断信号(Ctrl-C)。
- 例外情况:
但有些服务器为了防止通过ping探测到,通过防火墙设置了禁止
ping或者在内核参数中禁止ping,或者禁用了ICMP协议(工作层:IP层,而非TCP/UDP/网际层)————这样就不能通过ping确定该主机是否还处于开启状态。
- Linux Ping vs Windows Ping
linux下的ping和windows下的ping稍有区别
linux下ping不会自动终止,需要按ctrl+c终止或者用参数-c指定要求完成的回应次数。
原理
- ping 命令每秒发送一个数据报,并且为每个接收到的响应打印一行输出。
- ping 命令计算信号往返时间和(信息)包丢失情况的统计信息,并且在完成之后显示一个简要总结。
- ping 命令在程序超时或当接收到 SIGINT 信号时结束。
Host 参数或者是一个有效的主机名或者是因特网地址。
命令格式
ping [参数] [主机名或IP地址]
命令参数
-b表示使用广播地址向同一网络中的所有主机发送ping消息。这对于检测网络中所有主机的连通性非常有用。
如果有大量的主机需要进行测试,一个一个地输入目标主机的IP地址是非常繁琐且低效的。
这时候就可以利用ping命令的“-b”参数来向同一网络中的所有主机发送ping消息,以进行网络连通性测试。
- -d 使用Socket的SO_DEBUG功能。
- -f 极限检测。大量且快速地送网络封包给一台机器,看它的回应。
- -n 只输出数值。
- -q 不显示任何传送封包的信息,只显示最后的结果。
- -r 忽略普通的Routing Table,直接将数据包送到远端主机上。通常是查看本机的网络接口是否有问题。
- -R 记录路由过程。
- -v 详细显示指令的执行过程。
-c 数目:在发送指定数目的包后停止。
- -i 秒数:设定间隔几秒送一个网络封包给一台机器,预设值是一秒送一次。
- -I 网络界面:使用指定的网络界面送出数据包。
- -l 前置载入:设置在送出要求信息之前,先行发出的数据包。
- -p 范本样式:设置填满数据包的范本样式。
- -s 字节数:指定发送的数据字节数,预设值是56,加上8字节的ICMP头,一共是64ICMP数据字节。
- -t 存活数值:设置存活数值TTL的大小。
使用案例
CASE: ping得通的情况
[root@localhost ~]# ping 192.168.120.205
PING 192.168.120.205 (192.168.120.205) 56(84) bytes of data.
64 bytes from 192.168.120.205: icmp_seq=1 ttl=64 time=0.720 ms
64 bytes from 192.168.120.205: icmp_seq=2 ttl=64 time=0.181 ms
64 bytes from 192.168.120.205: icmp_seq=3 ttl=64 time=0.191 ms
64 bytes from 192.168.120.205: icmp_seq=4 ttl=64 time=0.188 ms
64 bytes from 192.168.120.205: icmp_seq=5 ttl=64 time=0.189 ms

--- 192.168.120.205 ping statistics ---
5 packets transmitted, 5 received, 0% packet loss, time 4000ms
rtt min/avg/max/mdev = 0.181/0.293/0.720/0.214 ms
[root@localhost ~]#
CASE: ping不通的情况
[root@localhost ~]# ping 192.168.120.202

PING 192.168.120.202 (192.168.120.202) 56(84) bytes of data.
From 192.168.120.204 icmp_seq=1 Destination Host Unreachable
From 192.168.120.204 icmp_seq=2 Destination Host Unreachable
From 192.168.120.204 icmp_seq=3 Destination Host Unreachable
From 192.168.120.204 icmp_seq=4 Destination Host Unreachable
From 192.168.120.204 icmp_seq=5 Destination Host Unreachable
From 192.168.120.204 icmp_seq=6 Destination Host Unreachable

--- 192.168.120.202 ping statistics ---
8 packets transmitted, 0 received, +6 errors, 100% packet loss, time 7005ms
, pipe 4
[root@localhost ~]#
CASE: ping -b 网关
[root@localhost ~]# route
Kernel IP routing table
Destination     Gateway         Genmask         Flags Metric Ref    Use Iface
192.168.120.0   *               255.255.255.0   U     0      0        0 eth0
192.168.0.0     192.168.120.1   255.255.0.0     UG    0      0        0 eth0
10.0.0.0        192.168.120.1   255.0.0.0       UG    0      0        0 eth0
default         192.168.120.240 0.0.0.0         UG    0      0        0 eth0

[root@localhost ~]# ping -b 192.168.120.1
PING 192.168.120.1 (192.168.120.1) 56(84) bytes of data.
64 bytes from 192.168.120.1: icmp_seq=1 ttl=255 time=2.02 ms
64 bytes from 192.168.120.1: icmp_seq=2 ttl=255 time=1.83 ms
64 bytes from 192.168.120.1: icmp_seq=3 ttl=255 time=1.68 ms
64 bytes from 192.168.120.1: icmp_seq=4 ttl=255 time=1.98 ms
64 bytes from 192.168.120.1: icmp_seq=5 ttl=255 time=1.88 ms

--- 192.168.120.1 ping statistics ---
5 packets transmitted, 5 received, 0% packet loss, time 4000ms
rtt min/avg/max/mdev = 1.682/1.880/2.020/0.129 ms
CASE : ping指定次数
[root@localhost ~]# ping -c 10 192.168.120.206
PING 192.168.120.206 (192.168.120.206) 56(84) bytes of data.
64 bytes from 192.168.120.206: icmp_seq=1 ttl=64 time=1.25 ms
64 bytes from 192.168.120.206: icmp_seq=2 ttl=64 time=0.260 ms
64 bytes from 192.168.120.206: icmp_seq=3 ttl=64 time=0.242 ms
64 bytes from 192.168.120.206: icmp_seq=4 ttl=64 time=0.271 ms
64 bytes from 192.168.120.206: icmp_seq=5 ttl=64 time=0.274 ms
64 bytes from 192.168.120.206: icmp_seq=6 ttl=64 time=0.295 ms
64 bytes from 192.168.120.206: icmp_seq=7 ttl=64 time=0.269 ms
64 bytes from 192.168.120.206: icmp_seq=8 ttl=64 time=0.270 ms
64 bytes from 192.168.120.206: icmp_seq=9 ttl=64 time=0.253 ms
64 bytes from 192.168.120.206: icmp_seq=10 ttl=64 time=0.289 ms

--- 192.168.120.206 ping statistics ---
10 packets transmitted, 10 received, 0% packet loss, time 9000ms
rtt min/avg/max/mdev = 0.242/0.367/1.251/0.295 ms
[root@localhost ~]#
CASE : 时间间隔和次数限制的ping
[root@localhost ~]# ping -c 10 -i 0.5 192.168.120.206
PING 192.168.120.206 (192.168.120.206) 56(84) bytes of data.
64 bytes from 192.168.120.206: icmp_seq=1 ttl=64 time=1.24 ms
64 bytes from 192.168.120.206: icmp_seq=2 ttl=64 time=0.235 ms
64 bytes from 192.168.120.206: icmp_seq=3 ttl=64 time=0.244 ms
64 bytes from 192.168.120.206: icmp_seq=4 ttl=64 time=0.300 ms
64 bytes from 192.168.120.206: icmp_seq=5 ttl=64 time=0.255 ms
64 bytes from 192.168.120.206: icmp_seq=6 ttl=64 time=0.264 ms
64 bytes from 192.168.120.206: icmp_seq=7 ttl=64 time=0.263 ms
64 bytes from 192.168.120.206: icmp_seq=8 ttl=64 time=0.331 ms
64 bytes from 192.168.120.206: icmp_seq=9 ttl=64 time=0.247 ms
64 bytes from 192.168.120.206: icmp_seq=10 ttl=64 time=0.244 ms

--- 192.168.120.206 ping statistics ---
10 packets transmitted, 10 received, 0% packet loss, time 4499ms
rtt min/avg/max/mdev = 0.235/0.362/1.241/0.294 ms


[root@localhost ~]# ping -c 10 -i 0.01 192.168.120.206
PING 192.168.120.206 (192.168.120.206) 56(84) bytes of data.
64 bytes from 192.168.120.206: icmp_seq=1 ttl=64 time=0.244 ms
64 bytes from 192.168.120.206: icmp_seq=2 ttl=64 time=0.195 ms
64 bytes from 192.168.120.206: icmp_seq=3 ttl=64 time=0.219 ms
64 bytes from 192.168.120.206: icmp_seq=4 ttl=64 time=0.204 ms
64 bytes from 192.168.120.206: icmp_seq=5 ttl=64 time=3.56 ms
64 bytes from 192.168.120.206: icmp_seq=6 ttl=64 time=1.93 ms
64 bytes from 192.168.120.206: icmp_seq=7 ttl=64 time=0.193 ms
64 bytes from 192.168.120.206: icmp_seq=8 ttl=64 time=0.193 ms
64 bytes from 192.168.120.206: icmp_seq=9 ttl=64 time=0.202 ms
64 bytes from 192.168.120.206: icmp_seq=10 ttl=64 time=0.211 ms

--- 192.168.120.206 ping statistics ---
10 packets transmitted, 10 received, 0% packet loss, time 90ms
rtt min/avg/max/mdev = 0.193/0.716/3.564/1.080 ms

[root@localhost ~]#
CASE: ping 公网域名
peida-VirtualBox ~ # ping -c 5 www.58.com
PING www.58.com (211.151.111.30) 56(84) bytes of data.
64 bytes from 211.151.111.30: icmp_req=1 ttl=49 time=14.7 ms
64 bytes from 211.151.111.30: icmp_req=2 ttl=49 time=16.4 ms
64 bytes from 211.151.111.30: icmp_req=3 ttl=49 time=15.2 ms
64 bytes from 211.151.111.30: icmp_req=4 ttl=49 time=14.6 ms
64 bytes from 211.151.111.30: icmp_req=5 ttl=49 time=19.9 ms

--- www.58.com ping statistics ---
5 packets transmitted, 5 received, 0% packet loss, time 20101ms
rtt min/avg/max/mdev = 14.618/16.192/19.917/1.965 ms
peida-VirtualBox ~ #
CASE : ping -i 3 -s 1024 -t 255 192.168.120.206
[root@localhost ~]# ping -i 3 -s 1024 -t 255 192.168.120.206

PING 192.168.120.206 (192.168.120.206) 1024(1052) bytes of data.
1032 bytes from 192.168.120.206: icmp_seq=1 ttl=64 time=1.99 ms
1032 bytes from 192.168.120.206: icmp_seq=2 ttl=64 time=0.694 ms
1032 bytes from 192.168.120.206: icmp_seq=3 ttl=64 time=0.300 ms
1032 bytes from 192.168.120.206: icmp_seq=4 ttl=64 time=0.481 ms
1032 bytes from 192.168.120.206: icmp_seq=5 ttl=64 time=0.415 ms
1032 bytes from 192.168.120.206: icmp_seq=6 ttl=64 time=0.600 ms
1032 bytes from 192.168.120.206: icmp_seq=7 ttl=64 time=0.411 ms
1032 bytes from 192.168.120.206: icmp_seq=8 ttl=64 time=0.281 ms
1032 bytes from 192.168.120.206: icmp_seq=9 ttl=64 time=0.318 ms
1032 bytes from 192.168.120.206: icmp_seq=10 ttl=64 time=0.362 ms
1032 bytes from 192.168.120.206: icmp_seq=11 ttl=64 time=0.408 ms
1032 bytes from 192.168.120.206: icmp_seq=12 ttl=64 time=0.445 ms
1032 bytes from 192.168.120.206: icmp_seq=13 ttl=64 time=0.397 ms
1032 bytes from 192.168.120.206: icmp_seq=14 ttl=64 time=0.406 ms
1032 bytes from 192.168.120.206: icmp_seq=15 ttl=64 time=0.458 ms

--- 192.168.120.206 ping statistics ---
15 packets transmitted, 15 received, 0% packet loss, time 41999ms
rtt min/avg/max/mdev = 0.281/0.531/1.993/0.404 ms

[root@localhost ~]#
-i3 发送周期为 3秒-s设置发送包的大小为1024-t设置TTL值为 255
CASE: ping或nslookup 域名能解析出ip,但目标主机无应答 => DNS正常,但与目标主机的网络不可达
[root@vmw-b gemini]# ping baidu.com
PING baidu.com (110.242.68.66) 56(84) bytes of data.
^C
--- baidu.com ping statistics ---
46 packets transmitted, 0 received, 100% packet loss, time 45102ms

# 安装 nslookup
[root@vmw-b gemini]# sudo yum install bind-utils


[root@vmw-b gemini]# nslookup baidu.com
Server:		192.168.100.102
Address:	192.168.100.102#53

Non-authoritative answer:
Name:	baidu.com
Address: 39.156.66.10
Name:	baidu.com
Address: 110.242.68.66
X 参考文献
traceroute : 网络可达性测验专用工具之路由跟踪工具
序: 契机 :目标进程及端口正常运行,但ssh -p始终无法与目标端口建立连接,报No route to host错误
问题描述
# 进程正常运行
[root@vmw-b conf]# netstat -lntp | grep -i ts-
tcp        0      0 192.168.101.102:6060    0.0.0.0:*               LISTEN      126871/bin/ts-store
tcp        0      0 192.168.101.102:6061    0.0.0.0:*               LISTEN      93187/bin/ts-sql
tcp        0      0 192.168.101.102:8400    0.0.0.0:*               LISTEN      126871/bin/ts-store
tcp        0      0 192.168.101.102:8401    0.0.0.0:*               LISTEN      126871/bin/ts-store
tcp        0      0 192.168.101.102:8088    0.0.0.0:*               LISTEN      126542/bin/ts-meta
tcp        0      0 192.168.101.102:8091    0.0.0.0:*               LISTEN      126542/bin/ts-meta
tcp        0      0 192.168.101.102:8092    0.0.0.0:*               LISTEN      126542/bin/ts-meta

# 能ping通
[root@vmw-b conf]# ping 192.168.101.102
PING 192.168.101.102 (192.168.101.102) 56(84) bytes of data.
64 bytes from 192.168.101.102: icmp_seq=1 ttl=64 time=0.058 ms
64 bytes from 192.168.101.102: icmp_seq=2 ttl=64 time=0.022 ms

# 防火墙确认已关闭
[root@vmw-b conf]# systemctl status firewalld
● firewalld.service - firewalld - dynamic firewall daemon
   Loaded: loaded (/usr/lib/systemd/system/firewalld.service; disabled; vendor preset: enabled)
   Active: inactive (dead)
     Docs: man:firewalld(1)
[root@vmw-b conf]# systemctl status iptables
Unit iptables.service could not be found.


# 但无法与目标端口建立TCP连接
[root@vmw-b conf]# ssh 192.168.100.102 -p 8092 -v
OpenSSH_7.4p1, OpenSSL 1.0.2k-fips  26 Jan 2017
debug1: Reading configuration data /root/.ssh/config
debug1: Reading configuration data /etc/ssh/ssh_config
debug1: /etc/ssh/ssh_config line 58: Applying options for *
debug1: Connecting to 192.168.100.102 [192.168.100.102] port 8092.
debug1: connect to address 192.168.100.102 port 8092: No route to host
ssh: connect to host 192.168.100.102 port 8092: No route to host

# 22端口确实是能通的
[root@vmw-b conf]# ssh 192.168.101.102 -p 22 -v
OpenSSH_7.4p1, OpenSSL 1.0.2k-fips  26 Jan 2017
debug1: Reading configuration data /root/.ssh/config
debug1: Reading configuration data /etc/ssh/ssh_config
debug1: /etc/ssh/ssh_config line 58: Applying options for *
debug1: Connecting to 192.168.101.102 [192.168.101.102] port 22.
debug1: Connection established.
debug1: permanently_set_uid: 0/0
debug1: key_load_public: No such file or directory
debug1: identity file /root/.ssh/id_rsa type -1
debug1: key_load_public: No such file or directory
debug1: identity file /root/.ssh/id_rsa-cert type -1
debug1: key_load_public: No such file or directory
debug1: identity file /root/.ssh/id_dsa type -1
debug1: key_load_public: No such file or directory
debug1: identity file /root/.ssh/id_dsa-cert type -1
debug1: key_load_public: No such file or directory
debug1: identity file /root/.ssh/id_ecdsa type -1
debug1: key_load_public: No such file or directory
debug1: identity file /root/.ssh/id_ecdsa-cert type -1
debug1: key_load_public: No such file or directory
debug1: identity file /root/.ssh/id_ed25519 type -1
debug1: key_load_public: No such file or directory
debug1: identity file /root/.ssh/id_ed25519-cert type -1
debug1: Enabling compatibility mode for protocol 2.0
debug1: Local version string SSH-2.0-OpenSSH_7.4
debug1: Remote protocol version 2.0, remote software version OpenSSH_7.4
debug1: match: OpenSSH_7.4 pat OpenSSH* compat 0x04000000
debug1: Authenticating to 192.168.101.102:22 as 'root'
debug1: SSH2_MSG_KEXINIT sent
debug1: SSH2_MSG_KEXINIT received
debug1: kex: algorithm: curve25519-sha256
debug1: kex: host key algorithm: ecdsa-sha2-nistp256
debug1: kex: server->client cipher: [email protected] MAC: <implicit> compression: none
debug1: kex: client->server cipher: [email protected] MAC: <implicit> compression: none
debug1: kex: curve25519-sha256 need=64 dh_need=64
debug1: kex: curve25519-sha256 need=64 dh_need=64
debug1: expecting SSH2_MSG_KEX_ECDH_REPLY
debug1: Server host key: ecdsa-sha2-nistp256 SHA256:ek330AQTVpEWkx0nJsQlhPo3W670CDxvJiDi/dAFrS0
The authenticity of host '192.168.101.102 (192.168.101.102)' can't be established.
ECDSA key fingerprint is SHA256:ek330AQTVpEWkx0nJsQlhPo3W670CDxvJiDi/dAFrS0.
ECDSA key fingerprint is MD5:dc:81:b8:6c:2a:9c:36:ac:56:38:41:3b:13:9c:20:b6.
Are you sure you want to continue connecting (yes/no)?
Host key verification failed.

# traceroute 测验路由
[root@vmw-b conf]# traceroute 192.168.101.102 -p 8092
traceroute to 192.168.101.102 (192.168.101.102), 30 hops max, 60 byte packets
 1  vmw-b.servers.com (192.168.101.102)  0.097 ms  0.016 ms  0.011 ms
[root@vmw-b conf]# traceroute 192.168.101.102
traceroute to 192.168.101.102 (192.168.101.102), 30 hops max, 60 byte packets
 1  vmw-b.servers.com (192.168.101.102)  0.038 ms  0.011 ms  0.014 ms
[root@vmw-b conf]# traceroute 192.168.101.103 -p 8092
traceroute to 192.168.101.103 (192.168.101.103), 30 hops max, 60 byte packets
 1  vmw-c.servers.com (192.168.101.103)  0.315 ms  0.224 ms  0.207 ms
[root@vmw-b conf]# traceroute 192.168.101.103
traceroute to 192.168.101.103 (192.168.101.103), 30 hops max, 60 byte packets
 1  vmw-c.servers.com (192.168.101.103)  0.229 ms  0.185 ms  0.188 ms
问题分析
- 出现
No route to host时,有几种可能:
1、对方的域名的确不通
2、本机开了防火墙
3、本机的 /etc/hosts 里面没有配置本机的机器名和ip
-
已确认不存在前2种情况
-
排查第3种情况,查看 hosts
# cat /etc/hosts
#127.0.0.1   localhost localhost.localdomain localhost4 localhost4.localdomain4
#::1         localhost localhost.localdomain localhost6 localhost6.localdomain6
127.0.0.1 localhost localhost.localdomain vmw-b.servers.com
::1         localhost localhost.localdomain vmw-b.servers.com
192.168.101.102 vmw-b.servers.com
192.168.101.103 vmw-c.servers.com
192.168.101.104 vmw-d.servers.com
192.168.101.105 vmw-e.servers.com
好像真是这个原因
解决方法
- 解决思路: 在
/etc/hosts文件里添加一个语句即可,即执行命令ssh-copy-id+主机名如有网友是 ssh-copy-id slave02
[root@vmw-b conf]# hostname
vmw-b.servers.com

[root@vmw-b conf]# ssh-copy-id vmw-b.servers.com
/usr/bin/ssh-copy-id: INFO: Source of key(s) to be installed: "/root/.ssh/id_rsa.vmw-b.pub"
/usr/bin/ssh-copy-id: INFO: attempting to log in with the new key(s), to filter out any that are already installed
/usr/bin/ssh-copy-id: INFO: 1 key(s) remain to be installed -- if you are prompted now it is to install the new keys
@@@@@@@@@@@@@@@@@@@@@@@@@@@@@@@@@@@@@@@@@@@@@@@@@@@@@@@@@@@
@         WARNING: UNPROTECTED PRIVATE KEY FILE!          @
@@@@@@@@@@@@@@@@@@@@@@@@@@@@@@@@@@@@@@@@@@@@@@@@@@@@@@@@@@@
Permissions 0620 for '/root/.ssh/id_rsa.vmw-b' are too open.
It is required that your private key files are NOT accessible by others.
This private key will be ignored.
Load key "/root/.ssh/id_rsa.vmw-b": bad permissions
[email protected]'s password:

Number of key(s) added: 1

Now try logging into the machine, with:   "ssh 'vmw-b.servers.com'"
and check to make sure that only the key(s) you wanted were added.
- 验证
[root@vmw-b conf]# cat /etc/hosts
#127.0.0.1   localhost localhost.localdomain localhost4 localhost4.localdomain4
#::1         localhost localhost.localdomain localhost6 localhost6.localdomain6
127.0.0.1 localhost localhost.localdomain vmw-b.servers.com
::1         localhost localhost.localdomain vmw-b.servers.com
192.168.101.102 vmw-b.servers.com
192.168.101.103 vmw-c.servers.com
192.168.101.104 vmw-d.servers.com
192.168.101.105 vmw-e.servers.com


[root@vmw-b conf]# ssh 192.168.101.102 -p 8092 -v
OpenSSH_7.4p1, OpenSSL 1.0.2k-fips  26 Jan 2017
debug1: Reading configuration data /root/.ssh/config
debug1: Reading configuration data /etc/ssh/ssh_config
debug1: /etc/ssh/ssh_config line 58: Applying options for *
debug1: Connecting to 192.168.101.102 [192.168.101.102] port 8092.
debug1: Connection established.
debug1: permanently_set_uid: 0/0
debug1: key_load_public: No such file or directory
debug1: identity file /root/.ssh/id_rsa type -1
debug1: key_load_public: No such file or directory
debug1: identity file /root/.ssh/id_rsa-cert type -1
debug1: key_load_public: No such file or directory
debug1: identity file /root/.ssh/id_dsa type -1
debug1: key_load_public: No such file or directory
debug1: identity file /root/.ssh/id_dsa-cert type -1
debug1: key_load_public: No such file or directory
debug1: identity file /root/.ssh/id_ecdsa type -1
debug1: key_load_public: No such file or directory
debug1: identity file /root/.ssh/id_ecdsa-cert type -1
debug1: key_load_public: No such file or directory
debug1: identity file /root/.ssh/id_ed25519 type -1
debug1: key_load_public: No such file or directory
debug1: identity file /root/.ssh/id_ed25519-cert type -1
debug1: Enabling compatibility mode for protocol 2.0
debug1: Local version string SSH-2.0-OpenSSH_7.4
ssh_exchange_identification: Connection closed by remote host
概述:traceroute
- 在Linux系统下,
traceroute是一个网络诊断工具,用于追踪一个数据包从源点到目的地所经过的路由路径。
它通过向目的地发送一系列的 UDP 或 ICMP 数据包,并记录每个数据包所经过的路由器,来显示数据包到达目的地的路径。
基本语法
traceroute的基本语法如下:
traceroute [选项] 目标主机
其中,
[选项]是可选的参数,用于定制traceroute的行为;
目标主机可以是目标主机的域名或IP地址。
命令参数
- Traceroute常用选项如下:
-4Use IPv4-6Use IPv6-d/--debugEnable socket level debugging- -g` gate,... --gateway=gate,...
-I使用 ICMP Echo 模式发送数据包。这是 traceroute 命令的默认模式。-U使用UDP模式发送数据包。该模式下的traceroute命令需要以root权限运行。-T使用TCP模式发送数据包。同样,该模式下的traceroute命令需要以root权限运行。-n不要解析IP地址为主机名,以IP地址形式显示主机名。-s源地址:指定源地址,可以是主机名或IP地址。-p端口号:指定源端口,以查找防火墙规则或过滤器的规则对目标主机的响应是否过滤。默认端口号通常为33434(UDP模式)。-q查询次数:设置查询次数,默认值为3。每次查询会增加TTL值,直到到达目标主机或达到最大的TTL值。-m跳数:设置最大的TTL值,默认值为30。该值指定了数据包能经过的最大路由器数量。当数据包的TTL值达到该值时,数据包会被丢弃。-w等待时间:指定每个数据包的超时时间。
- 帮助信息
traceroute --help
输出结果解释
traceroute的输出结果通常分为多列,每列代表一个“跳点”(即数据包经过的路由器或主机)。- 每一行代表一个跳点,通常包括:
(1)跳点的序号(从1开始)。
(2)该跳点的IP地址。
(3)主机名(如果使用了-n选项,则不会显示主机名)。
(4)三个时间值(ms),分别代表三次尝试到达该跳点所需的时间。如果某个时间值为星号,则表示该次尝试超时。
使用案例
CASE : 使用默认模式(ICMP Echo)追踪到目标主机
[root@vmw-b conf]# traceroute www.baidu.com
traceroute to www.baidu.com (183.2.172.185), 30 hops max, 60 byte packets
 1  * * *
 2  182.150.116.1 (182.150.116.1)  6.999 ms  6.853 ms  8.936 ms
 3  165.250.70.125.broad.cd.sc.dynamic.163data.com.cn (125.70.250.165)  11.328 ms  11.056 ms  14.787 ms
 4  61.139.121.13 (61.139.121.13)  10.658 ms 61.139.121.33 (61.139.121.33)  27.199 ms 61.139.121.45 (61.139.121.45)  7.473 ms
 5  * 202.97.69.82 (202.97.69.82)  34.520 ms 202.97.21.173 (202.97.21.173)  31.760 ms
 6  * 113.96.5.126 (113.96.5.126)  40.594 ms 113.96.4.214 (113.96.4.214)  35.413 ms
 7  * * *
 8  14.29.117.178 (14.29.117.178)  35.478 ms  35.367 ms 14.29.117.170 (14.29.117.170)  34.684 ms
 9  * * *
10  * * *
11  * * *
12  * * *
13  * * *
14  * * *
15  * * *
16  * * *
17  * * *
18  * * *
19  * * *
20  * * *
21  * * *
22  * * *
23  * * *
24  * * *
25  * * *
26  * * *
27  * * *
28  * * *
29  * * *
30  * * *
[root@vmw-b conf]#
CASE : 使用UDP模式(需要root权限)追踪到目标主机
[root@vmw-b conf]# sudo traceroute -U www.baidu.com
traceroute to www.baidu.com (183.2.172.42), 30 hops max, 60 byte packets
 1  * * *
 2  182.150.116.1 (182.150.116.1)  5.775 ms  5.388 ms  5.314 ms
 3  * * *
 4  * 61.139.121.13 (61.139.121.13)  12.694 ms *
 5  * * *
 6  * 113.96.4.50 (113.96.4.50)  36.324 ms 113.96.5.170 (113.96.5.170)  41.602 ms
 7  * * *
 8  14.29.117.170 (14.29.117.170)  32.996 ms 14.29.117.178 (14.29.117.178)  34.198 ms  35.765 ms
 9  * * *
10  * * *
11  * * *
12  * * *
13  * * *
14  * * *
15  * * *
16  * * *
17  * * *
18  * * *
19  * * *
20  * * *
21  * * *
22  * * *
23  * * *
24  * * *
25  * * *
26  * * *
27  * * *
28  * * *
29  * * *
30  * * *
[root@vmw-b conf]#
CASE : 不解析IP地址为主机名,直接显示IP地址
[root@vmw-b conf]# traceroute -n www.baidu.com
traceroute to www.baidu.com (183.2.172.185), 30 hops max, 60 byte packets
 1  * * *
 2  182.150.116.1  9.861 ms  9.323 ms  9.246 ms
 3  125.70.250.165  10.452 ms  7.489 ms  8.874 ms
 4  61.139.121.41  7.219 ms 171.208.203.65  9.345 ms 61.139.121.41  8.801 ms
 5  202.97.30.146  33.762 ms 202.97.113.33  32.993 ms 202.97.82.213  32.964 ms
 6  113.96.4.218  36.828 ms 219.128.214.46  32.203 ms *
 7  219.135.96.130  63.911 ms * 219.135.96.146  65.759 ms
 8  14.29.117.170  36.039 ms 14.29.117.178  36.792 ms  37.816 ms
 9  * * *
10  * * *
11  * * *
12  * * *
13  * * *
14  * * *
15  * * *
16  * * *
17  * * *
18  * * *
19  * * *
20  * * *
21  * * *
22  * * *
23  * * *
24  * * *
25  * * *
26  * * *
27  * * *
28  * * *
29  * * *
30  * * *
[root@vmw-b conf]#
CASE : 探测包使用UDP,端口设置为443
[root@vmw-b conf]# traceroute -p 443 www.baidu.com
traceroute to www.baidu.com (183.2.172.42), 30 hops max, 60 byte packets
 1  * * *
 2  182.150.116.1 (182.150.116.1)  8.379 ms  7.071 ms  8.235 ms
 3  * * *
 4  * * *
 5  * * *
 6  * * 113.96.5.66 (113.96.5.66)  30.682 ms
 7  * * *
 8  14.29.117.170 (14.29.117.170)  31.670 ms  33.403 ms 14.29.117.178 (14.29.117.178)  34.059 ms
 9  * * *
10  * * *
11  * * *
12  * * *
13  * * *
14  * * *
15  * * *
16  * * *
17  * * *
18  * * *
19  * * *
20  * * *
21  * * *
22  * * *
23  * * *
24  * * *
25  * * *
26  * * *
27  * * *
28  * * *
29  * * *
30  * * *
[root@vmw-b conf]#


[root@vmw-b conf]# traceroute -p 44334 www.baidu.com
traceroute to www.baidu.com (183.2.172.185), 30 hops max, 60 byte packets
 1  * * *
 2  182.150.116.1 (182.150.116.1)  8.782 ms  8.678 ms  6.904 ms
 3  * * *
 4  * * *
 5  * * *
 6  113.96.4.158 (113.96.4.158)  33.418 ms * *
 7  * * *
 8  14.29.117.178 (14.29.117.178)  38.841 ms  52.859 ms  52.804 ms
 9  * * *
10  * * *
11  * * *
12  * * *
13  * * *
14  * * *
15  * * *
16  * * *
17  * * *
18  * * *
19  * * *
20  * * *
21  * * *
22  * * *
23  * * *
24  * * *
25  * * *
26  * * *
27  * * *
28  * * *
29  * * *
30  * * *


[root@vmw-b conf]# traceroute -p 65535 www.baidu.com
traceroute to www.baidu.com (183.2.172.185), 30 hops max, 60 byte packets
 1  * * *
 2  182.150.116.1 (182.150.116.1)  16.416 ms  1593.969 ms  16.124 ms
 3  * * *
 4  * * *
 5  * * *
 6  * * *
 7  * * *
 8  14.29.117.170 (14.29.117.170)  35.899 ms  38.164 ms  1515.546 ms
 9  * * *
10  * * *
11  * * *
12  * * *
13  * * *
14  * * *
15  * * *
16  * * *
17  * * *
18  * * *
19  * * *
20  * * *
21  * * *
22  * * *
23  * * *
24  * * *
25  * * *
26  * * *
27  * * *
28  * * *
29  * * *
30  * * *
[root@vmw-b conf]#
CASE : 设置查询次数为n次
也就是把探测包的个数设置为值n
[root@vmw-b conf]# traceroute -q 5 www.baidu.com
traceroute to www.baidu.com (183.2.172.42), 30 hops max, 60 byte packets
 1  * * * * *
 2  182.150.116.1 (182.150.116.1)  4.749 ms  4.429 ms  4.178 ms  3.910 ms  6.333 ms
 3  182.150.190.213 (182.150.190.213)  18.825 ms  18.543 ms  18.232 ms  17.893 ms  17.607 ms
 4  171.208.199.193 (171.208.199.193)  5.492 ms 61.139.121.45 (61.139.121.45)  6.897 ms 171.208.199.177 (171.208.199.177)  5.281 ms 61.139.121.45 (61.139.121.45)  5.126 ms *
 5  202.97.82.245 (202.97.82.245)  28.557 ms * 202.97.82.213 (202.97.82.213)  29.437 ms * 202.97.69.82 (202.97.69.82)  31.988 ms
 6  54.214.128.219.broad.st.gd.dynamic.163data.com.cn (219.128.214.54)  35.353 ms * 113.96.4.174 (113.96.4.174)  32.685 ms * 46.214.128.219.broad.st.gd.dynamic.163data.com.cn (219.128.214.46)  31.214 ms
 7  * * * * *
 8  14.29.117.170 (14.29.117.170)  37.005 ms 14.29.117.178 (14.29.117.178)  34.349 ms 14.29.117.170 (14.29.117.170)  30.243 ms  32.151 ms 14.29.117.178 (14.29.117.178)  39.619 ms
 9  * * * * *
10  * * * * *
11  * * * * *
12  * * 14.29.117.178 (14.29.117.178)  55.064 ms 14.29.117.170 (14.29.117.170)  63.088 ms 14.29.117.178 (14.29.117.178)  58.037 ms
13  * * * * *
14  * * * * *
15  * * * * *
16  * * * * *
17  * * * * *
18  * * * * *
19  * * * * *
20  * * * * *
21  * * * * *
22  * * * * *
23  * * * * *
24  * * * * *
25  * * * * *
26  * * * * *
27  * * * * *
28  * * * * *
29  * * * * *
30  * * * * *
[root@vmw-b conf]#
CASE : 跳数设置为m次
[root@vmw-b conf]# traceroute -m 10 www.baidu.com
traceroute to www.baidu.com (183.2.172.42), 10 hops max, 60 byte packets
 1  * * *
 2  182.150.116.1 (182.150.116.1)  6.615 ms  7.554 ms  6.307 ms
 3  182.150.190.213 (182.150.190.213)  15.367 ms  15.212 ms  15.068 ms
 4  61.139.121.17 (61.139.121.17)  7.781 ms 171.208.199.65 (171.208.199.65)  11.013 ms 61.139.121.13 (61.139.121.13)  7.491 ms
 5  202.97.106.221 (202.97.106.221)  32.941 ms 202.97.29.17 (202.97.29.17)  30.786 ms 202.97.30.150 (202.97.30.150)  34.584 ms
 6  113.96.4.222 (113.96.4.222)  38.385 ms 113.96.5.166 (113.96.5.166)  33.226 ms 113.96.5.126 (113.96.5.126)  35.626 ms
 7  * * *
 8  14.29.117.170 (14.29.117.170)  29.563 ms  33.477 ms  38.499 ms
 9  * * *
10  * * *
工作原理
-
Traceroute的工作原理主要基于ICMP(Internet Control Message Protocol)和IP头部的TTL(Time To Live)字段。如下图所示: -
Traceroute通过发送不同TTL值的IP数据包来追踪数据包从源主机(源主机SA)到目的主机(目标主机DA)所经过的路由。
- 具体来说,第一步,Traceroute首先发送一个TTL为1的IP数据包,这个数据包的TTL每经过一个路由器时减1,直到TTL变为0,此时路由器会将该数据包丢弃并返回一个ICMP超时消息给源主机。Traceroute接收到这个ICMP消息后,就知道该路由器存在于路径上。
- 接着,第2步,Traceroute会发送下一个TTL为2的IP数据包,以此类推,直到数据包到达目的主机(目标主机DA)。
- 当数据包到达目的(主机目标主机DA)时,目的主机的操作系统会返回一个ICMP不可达消息,因为目的主机的端口号通常不会用于Traceroute发送的UDP数据包。这样,Traceroute就能知道目的主机已经到达。
- 此外,Traceroute还可以通过发送UDP数据包来检测目的主机的可达性。这些UDP数据包的端口号通常是一个大于30000的随机值,以避免与常规应用程序的端口冲突。当这些UDP数据包到达目的主机时,目的主机的操作系统会返回一个ICMP不可达消息,表明UDP数据包的目的端口不可达。
- Traceroute通过这种方式,可以记录下从源主机到目的主机所经过的每个路由器的IP地址,以及每个路由器处理数据包的时间。这样,用户就可以看到数据包从源到目的地的完整路径。
安装
- 在CentOS系统中,traceroute 通常可以通过包管理器安装。对于大多数CentOS版本,traceroute 可能已经预装,如果没有安装,可以使用 yum 包管理器安装。
sudo yum install traceroute
注意事项
- 在使用UDP或TCP模式时,traceroute可能会受到防火墙或安全设备的限制,因为这些模式需要发送额外的数据包。
- ICMP Echo模式(默认模式)通常较为通用,但也可能在某些情况下受到限制。
# 关闭 ICMP 协议 | 方法1 在OUTPUT链上添加规则,表示将所有ICMP报文丢弃
iptables -A OUTPUT -p icmp -j DROP

# 关闭 ICMP 协议 | 方法2 使用sysctl命令修改内核参数 = 将修改内核参数net.ipv4.icmp_echo_ignore_all的值为1,表示忽略所有的ICMP回显请求
sysctl -w net.ipv4.icmp_echo_ignore_all=1

# 关闭 ICMP 协议 | 方法3 使用防火墙配置工具(如ufw、firewalld等),在防火墙配置中添加规则,禁止出站ICMP流量
ufw deny out icmp
或 firewall-cmd --zone=public --add-rich-rule='rule family="ipv4" source address="0.0.0.0/0" protocol value="icmp" drop'
- 在使用traceroute命令时,请确保您有权访问目标主机,并尊重目标主机的网络安全策略。
参考文献
X 推荐文献
- [网络/Linux]CentOS7:OpenSSH升级到7.9p1 | 含: 安装Telnet/OpenSSH【telnet/ssh】 - 博客园/千千寰宇
- [网络/Linux]网络嗅探工具——nmap - 博客园/千千寰宇
- [Linux/OS] 常用命令之【ping/network/NetworkManager/ip/ifconfig/ifup/ifdown/nslookup/dig/dhclient】 | 基于CENTOS 7的网络服务与配置管理 - 博客园/千千寰宇
- [Linux]Xshell连接Centos7能Ping通但无法连接问题[ssh(d)+firewalld/iptables+chkconfig] - 博客园/千千寰宇