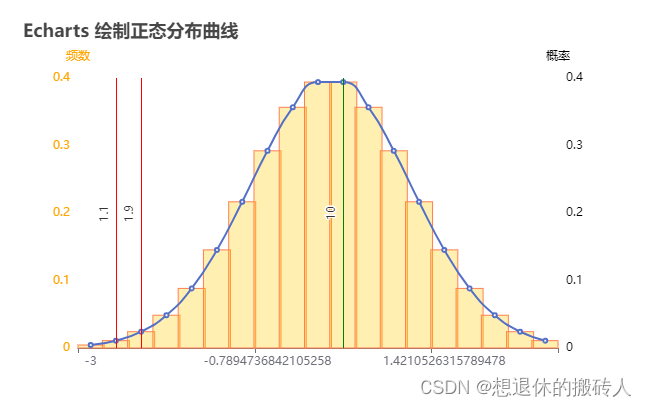
<template>
  <div id="main"></div>
</template>

<script setup>
import { onMounted } from "vue";
import * as echarts from "echarts";
let data={
  x:[
    -3,-2.6842105263157894,-2.3684210526315788,
    -2.052631578947368,-1.7368421052631575,-1.421052631578947,-1.1052631578947363,
    -0.7894736842105258,-0.47368421052631526,-0.15789473684210475,
    0.15789473684210575,0.47368421052631626,0.7894736842105268,
    1.1052631578947372,1.4210526315789478,1.7368421052631584,
    2.052631578947369, 2.3684210526315796,2.6842105263157903],
  y:[
    0.0044318484119380075, 0.010873446008403894,   0.02414573124668899,
    0.04852933916733306,   0.08827937454560608, 0.14534663197630093,
    0.21659157163219764,   0.292125176410827, 0.3566048764304543,
    0.394000182232257,   0.39400018223225697, 0.3566048764304541,
    0.29212517641082686,  0.21659157163219742, 0.14534663197630074,
    0.08827937454560594,   0.04852933916733297, 0.024145731246688947,
    0.010873446008403865],
};
const sum=()=> {
  if (data.y.length === 0) return 0
  return data.y.reduce((prev, curr) => prev + curr)
};
const average=()=> {
  return sum() / data.y.length
};
console.log('平均值',average());
let median;
const deviation=()=> {
  // 1、求平均数
  const avg = average();
  // 2、返回偏差。 f(x) = x - avg
  return data.y.map(x => x - avg)
};
console.log('偏差',deviation());
const variance=()=> {
  if (data.y.length === 0) return 0
      // 1、求偏差
  const dev = deviation();
      // 2、求偏差平方和
  const sumOfSquOfDev = dev.map(x => x * x).reduce((x, y) => x + y)
      // 3、返回方差
  return sumOfSquOfDev / data.y.length - 1
};
console.log('方差',variance());
const  standardDeviation=() =>{
    return (Math.sqrt(Math.abs(-variance())))
};
console.log('标准差',standardDeviation());
const standarDevRangeOfOne=() =>{
    return {
        low: average() - 1 * standardDeviation(),
        up: average() + 1 * standardDeviation()
    }
};
console.log('1倍标准偏差',standarDevRangeOfOne());
const standarDevRangeOfTwo=()=> {
    return {
        low: average() - 2 * standardDeviation(),
        up: average() + 2 * standardDeviation()
    }
};
console.log('2倍标准偏差',standarDevRangeOfTwo());
const standarDevRangeOfThree=()=> {
    return {
        low: average() - 3 * standardDeviation(),
        up: average() + 3 * standardDeviation()
    }
};
console.log('3倍标准偏差',standarDevRangeOfThree());
const min=() =>{
  return Math.min(...data.y)
};
console.log('min',min());
const max=() =>{
  return Math.max(...data.y)
};
console.log('max',max());
onMounted(() => {
  // 1.基于准备好的dom,初始化echarts实例
  var myChart = echarts.init(document.getElementById("main"));
  // 2.指定图表的配置项和数据, Echarts 图的配置
  var option = {
    // Echarts 图 -- 标题
    title: {
      text: 'Echarts 绘制正态分布曲线'
    },
    // Echarts 图 -- 工具
    tooltip: {},
    // Echarts 图 -- 图例
    legend: {
      data: ['f(x)']
    },
    // Echarts 图 -- x 坐标轴刻度 -- 正态分布数值
    xAxis: [{
      // name : "标准刻度(0.1)",
      data: data.x,
      // min: this.min,
      // max: this.max
    }],
     // Echarts 图 -- y 坐标轴刻度
    yAxis: [
      {
        type: 'value',
        name: '频数',
        position: 'left',
        // 网格线
        splitLine: {
            show: false
        },
        axisLine: {
            lineStyle: {
                color: 'orange'
            }
        },
        axisLabel: {
            formatter: '{value}'
        }
      },
      {
        type: 'value',
        name: '概率',
        position: 'right',
        // 网格线
        splitLine: {
            show: false
        },
        axisLine: {
            lineStyle: {
                color: 'black'
            }
        },
        axisLabel: {
            formatter: '{value}'
        }
      },
    ],
    // Echarts 图 -- y 轴数据
    series: [
      {
        name: '源数据', // y 轴名称
        type: 'bar', // y 轴类型
        yAxisIndex: 0,
        barGap: 0,
        barWidth: 27,
        itemStyle: {
            normal: {
                show: true,
                color: 'rgba(255, 204, 0,.3)', //柱子颜色
                borderColor: '#FF7F50' //边框颜色
            }
        },
        data: data.y, // y 轴数据 -- 源数据
      },
      {
        name: '正态分布', // y 轴名称
        type: 'line', // y 轴类型
        // symbol: 'none', //去掉折线图中的节点
        smooth: true, //true 为平滑曲线
        yAxisIndex: 1,
        data: data.y, // y 轴数据 -- 正态分布
        // 警示线
        markLine: {
          symbol: ['none'], // 箭头方向
          lineStyle: {
              type: "silent",
              color: "green",
          },
          itemStyle: {
              normal: {
                  show: true,
                  color: 'black'
              }
          },
          label: {
              show: true,
              position: "middle"
          },
          data: [
            {
              name: '一倍标准差',
              xAxis: standarDevRangeOfOne().low.toFixed(1),
              // 当 n 倍标准差在坐标轴外时,将其隐藏,否则它会默认显示在最小值部分,容易引起混淆
              lineStyle: {
                  opacity: (min() > standarDevRangeOfOne()
                      .low) ? 0 : 1
              },
              label: {
                  show: !(min() > standarDevRangeOfOne().low)
              }
            },
            {
              name: '一倍标准差',
              xAxis: standarDevRangeOfOne().up.toFixed(1),
              lineStyle: {
                  opacity: (max() < standarDevRangeOfOne().up) ?
                      0 : 1
              },
              label: {
                  show: !(max() < standarDevRangeOfOne().up)
              }
            },
            {
              name: '二倍标准差',
              xAxis: standarDevRangeOfTwo().low.toFixed(1),
              lineStyle: {
                  opacity: (min() > standarDevRangeOfTwo()
                      .low) ? 0 : 1
              },
              label: {
                  show: !(min() > standarDevRangeOfTwo().low)
              }
            },
            {
              name: '二倍标准差',
              xAxis: standarDevRangeOfTwo().up.toFixed(1),
              lineStyle: {
                  opacity: (max() < standarDevRangeOfTwo()
                      .up) ? 0 : 1
              },
              label: {
                  show: !(max() < standarDevRangeOfTwo().up)
              }
            },
            {
              name: '三倍标准差',
              xAxis: standarDevRangeOfThree().low.toFixed(1),
              lineStyle: {
                  opacity: (min() > standarDevRangeOfThree()
                      .low) ? 0 : 1
              },
              label: {
                  show: !(min() > standarDevRangeOfThree().low)
              }
            },
            {
              name: '三倍标准差',
              xAxis: standarDevRangeOfThree().up.toFixed(1),
              lineStyle: {
                  opacity: (max() < standarDevRangeOfThree()
                      .up) ? 0 : 1
              },
              label: {
                  show: !(max() < standarDevRangeOfThree().up)
              }
            },
            {
              name: '平均值',
              xAxis: average().toFixed(1),
              lineStyle: {
                  color: 'red'
              }
            },
            {
              name: '中位值',
              xAxis: 10,
              lineStyle: {
                  color: 'green'
              }
            },
            {
              name: '下偏差',
              xAxis: 1.1,
              lineStyle: {
                    color: 'red'
                }
            },
            {
              name: '上偏差',
              xAxis: 1.9,
              lineStyle: {
                  color: 'red'
                }
            }
          ]
        }
    }
  ],
  };
  // 3.使用刚指定的配置项和数据显示图表。
  myChart.setOption(option);
  window.addEventListener("resize", () => {
    myChart.resize()
  })
});
</script>

<style>
#main {
  width: 600px;
  height: 400px;
}
</style>
