import matplotlib. pyplot as plt
import numpy as np
plt. rcParams[ 'font.sans-serif' ] = [ 'SimHei' ]
plt. rcParams[ 'axes.unicode_minus' ] = False
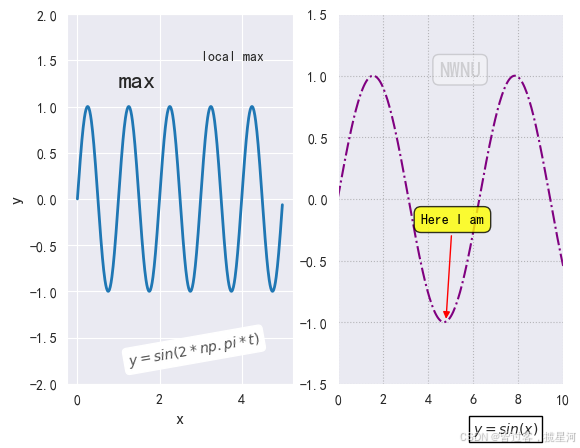
fig = plt. figure( )
ax1 = fig. add_subplot( 121 )
t = np. arange( 0.0 , 5 , 0.01 )
s = np. sin( 2 * np. pi * t)
ax1. plot( t, s, lw= 2 )
bbox = dict ( boxstyle= 'round' , fc = 'white' )
plt. annotate( 'local max' , xy = ( 2.3 , 1 ) , xytext= ( 3 , 1.5 ) )
arrowprops = dict ( facecolor = 'black' , edgecolor = 'red' , headwidth = 7 , width= 2 )
bbox_prop = dict ( fc = 'white' )
ax1. set_ylabel( 'y' , fontsize = 12 )
ax1. set_xlabel( 'x' , fontsize = 12 )
ax1. set_ylim( - 2 , 2 )
ax1. text( 1 , 1.2 , 'max' , fontsize = 18 )
ax1. text( 1.2 , - 1.8 , '$y=sin(2*np.pi*t)$' , bbox = bbox, rotation = 10 , alpha = 0.8 )
ax2 = fig. add_subplot( 122 )
x = np. linspace( 0 , 10 , 200 )
y = np. sin( x)
ax2. plot( x, y, linestyle = '-.' , color = 'purple' )
ax2. annotate( text = 'Here I am' , xy = ( 4.8 , np. sin( 4.8 ) ) , xytext= ( 3.7 , - 0.2 ) , weight= 'bold' , color= 'k' ,
arrowprops= dict ( arrowstyle = '-|>' , connectionstyle = 'arc3' , color = 'red' ) ,
bbox = dict ( boxstyle = 'round, pad=0.5' , fc = 'yellow' , ec = 'k' , lw = 1 , alpha = 0.8 ) )
ax2. set_ylim( - 1.5 , 1.5 )
ax2. set_xlim( 0 , 10 )
bbox = dict ( boxstyle = 'round' , ec = 'red' , fc = 'white' )
ax2. text( 6 , - 1.9 , '$y=sin(x)$' , bbox = dict ( boxstyle = 'square' , facecolor = 'white' , ec = 'black' ) )
ax2. grid( ls = ':' , color = 'gray' , alpha = 0.5 )
ax2. text( 4.5 , 1 , '老李制作' , fontsize = 15 , alpha = 0.3 , color = 'gray' , bbox = dict ( fc = 'white' , boxstyle = 'round' , edgecolor = 'gray' , alpha = 0.3 ) )
plt. show( )
实战案例开始
import pandas as pd
import numpy as np
from pandas import Series, DataFrame
import matplotlib. pyplot as plt
plt. rcParams[ 'font.sans-serif' ] = [ 'SimHei' ]
plt. rcParams[ 'axes.unicode_minus' ] = False
starbucks = pd. read_csv( 'directory.csv' )
starbucks. head( )
Brand Store Number Store Name Ownership Type Street Address City State/Province Country Postcode Phone Number Timezone Longitude Latitude 0 Starbucks 47370-257954 Meritxell, 96 Licensed Av. Meritxell, 96 Andorra la Vella 7 AD AD500 376818720 GMT+1:00 Europe/Andorra 1.53 42.51 1 Starbucks 22331-212325 Ajman Drive Thru Licensed 1 Street 69, Al Jarf Ajman AJ AE NaN NaN GMT+04:00 Asia/Dubai 55.47 25.42 2 Starbucks 47089-256771 Dana Mall Licensed Sheikh Khalifa Bin Zayed St. Ajman AJ AE NaN NaN GMT+04:00 Asia/Dubai 55.47 25.39 3 Starbucks 22126-218024 Twofour 54 Licensed Al Salam Street Abu Dhabi AZ AE NaN NaN GMT+04:00 Asia/Dubai 54.38 24.48 4 Starbucks 17127-178586 Al Ain Tower Licensed Khaldiya Area, Abu Dhabi Island Abu Dhabi AZ AE NaN NaN GMT+04:00 Asia/Dubai 54.54 24.51
print ( '星巴克旗下品牌有:\n' , starbucks. Brand. value_counts( ) )
coffee = starbucks[ starbucks. Brand == 'Starbucks' ]
print ( "\n" , coffee. shape)
星巴克旗下品牌有:
 Brand
Starbucks                25249
Teavana                    348
Evolution Fresh              2
Coffee House Holdings        1
Name: count, dtype: int64

 (25249, 13)
df = starbucks. groupby( [ "Country" ] ) . size( )
print ( '全世界一共有多少个国家和地区开设了星巴克门店:' , df. size)
df1 = df. sort_values( ascending= False )
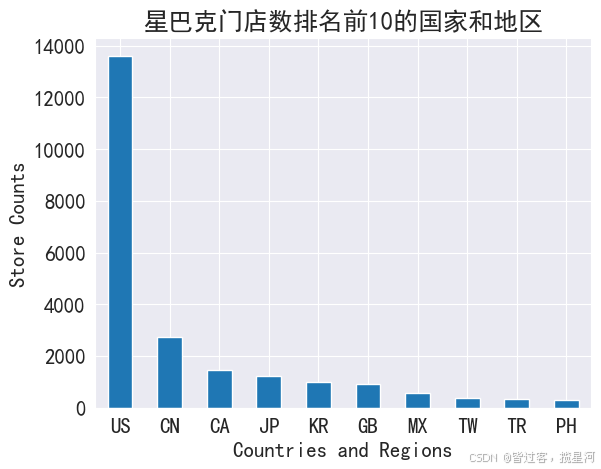
print ( '排名前10的国家和地区:\n' , df1. head( 10 ) )
全世界一共有多少个国家和地区开设了星巴克门店: 73
排名前10的国家和地区:
 Country
US    13608
CN     2734
CA     1468
JP     1237
KR      993
GB      901
MX      579
TW      394
TR      326
PH      298
dtype: int64
print ( '排名后10的国家:\n' , df1. tail( 10 ) )
排名后10的国家:
 Country
AZ    4
KH    4
TT    3
AW    3
CW    3
SK    3
ZA    3
LU    2
MC    2
AD    1
dtype: int64
plt. rcParams[ 'font.size' ] = 15
plt. rcParams[ 'font.family' ] = 'SimHei'
df1. head( 10 ) . plot( kind = 'bar' , rot = 0 )
plt. title( '星巴克门店数排名前10的国家和地区' )
plt. ylabel( 'Store Counts' )
plt. xlabel( 'Countries and Regions' )
Text(0.5, 0, 'Countries and Regions')
count_starbucks_city = coffee. City. value_counts( )
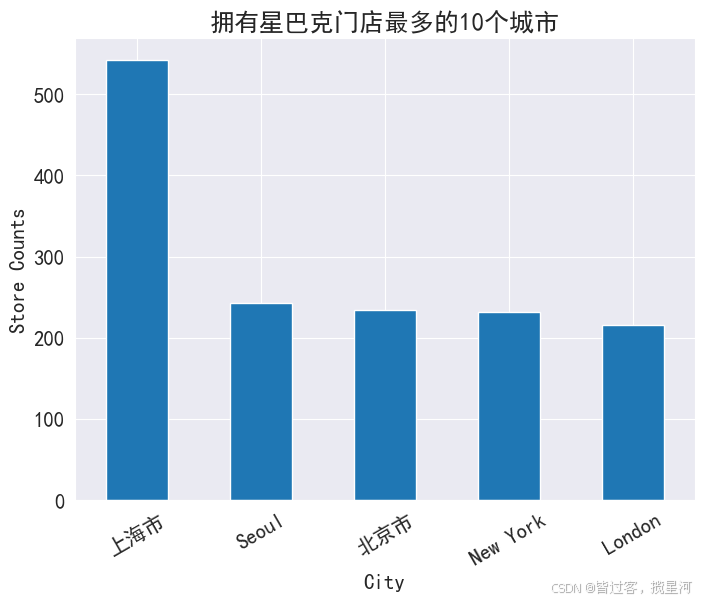
print ( '星巴克门店数量排名前10的城市:\n' , count_starbucks_city. head( 10 ) )
star = starbucks. dropna( how = 'any' , subset= [ 'City' ] )
count_starbucks_city = star. City. value_counts( )
print ( '全世界星巴克门店数量排名前10的城市:\n' , count_starbucks_city( 10 ) )
星巴克门店数量排名前10的城市:
 City
上海市            542
Seoul          243
北京市            234
New York       230
London         215
Toronto        186
Mexico City    180
Chicago        179
Las Vegas      153
Seattle        151
Name: count, dtype: int64


---------------------------------------------------------------------------

TypeError                                 Traceback (most recent call last)

Cell In[24], line 6
      4 star = starbucks.dropna(how = 'any', subset= ['City'])
      5 count_starbucks_city = star.City.value_counts()
----> 6 print('全世界星巴克门店数量排名前10的城市:\n', count_starbucks_city(10))


TypeError: 'Series' object is not callable
plt. figure( 1 , figsize= ( 8 , 6 ) )
count_starbucks_city = star. City. value_counts( )
city_top10 = count_starbucks_city. head( )
city_top10. plot( kind = 'bar' , rot = 30 )
plt. title( '拥有星巴克门店最多的10个城市' )
plt. ylabel( 'Store Counts' )
plt. xlabel( 'City' )
Text(0.5, 0, 'City')
import pinyin
df = star[ star[ 'Country' ] == 'CN' ]
df1 = df. copy( )
df1[ 'City' ] = df1[ 'City' ] . apply ( lambda x: x. lower( ) )
df1[ 'City' ] = df1[ 'City' ] . apply (
lambda x: pinyin. get( x, format = 'strip' , delimiter = '' ) [ 0 : - 3 ] )
df1 = df1. groupby( [ 'City' ] ) . size( ) . sort_values( ascending= False )
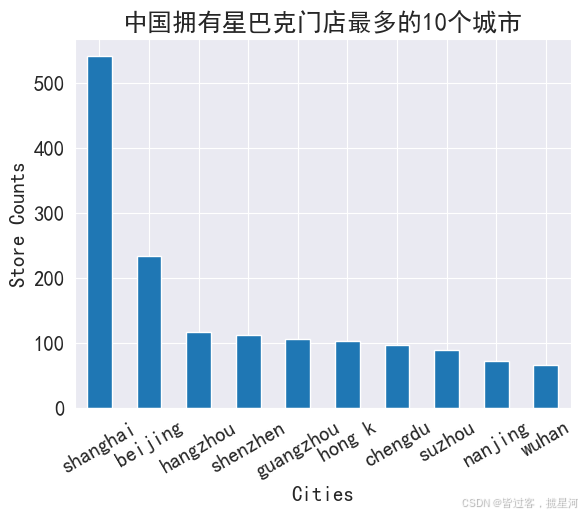
df1. head( 10 )
City
shanghai     542
beijing      234
hangzhou     117
shenzhen     113
guangzhou    106
hong k       104
chengdu       98
suzhou        90
nanjing       73
wuhan         67
dtype: int64
df1. head( 10 ) . plot( kind = 'bar' , rot = 30 )
plt. title( '中国拥有星巴克门店最多的10个城市' )
plt. ylabel( 'Store Counts' )
plt. xlabel( 'Cities' )
Text(0.5, 0, 'Cities')
plt. figure( 1 , figsize= ( 8 , 6 ) )
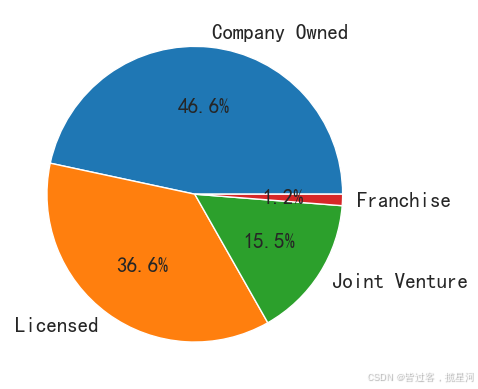
ownership = star[ 'Ownership Type' ] . value_counts( )
plt. title( '星巴克门店所有权类型' )
ownership. plot( kind = 'pie' )
plt. show( )
plt. pie( ownership. values, autopct= '%.1f%%' , labels= ownership. index)
plt. show( )
import numpy as np
import pandas as pd
import datetime
import matplotlib. pyplot as plt
import seaborn as sns
bike = pd. read_csv( 'bike.csv' )
bike. head( )
datetime season holiday workingday weather temp atemp humidity windspeed casual registered count 0 2011-01-01 00:00:00 1 0 0 1 9.84 14.395 81 0.0 3 13 16 1 2011-01-01 01:00:00 1 0 0 1 9.02 13.635 80 0.0 8 32 40 2 2011-01-01 02:00:00 1 0 0 1 9.02 13.635 80 0.0 5 27 32 3 2011-01-01 03:00:00 1 0 0 1 9.84 14.395 75 0.0 3 10 13 4 2011-01-01 04:00:00 1 0 0 1 9.84 14.395 75 0.0 0 1 1
bike. info( )
<class 'pandas.core.frame.DataFrame'>
RangeIndex: 10886 entries, 0 to 10885
Data columns (total 12 columns):
 #   Column      Non-Null Count  Dtype
---  ------      --------------  -----
 0   datetime    10886 non-null  object
 1   season      10886 non-null  int64
 2   holiday     10886 non-null  int64
 3   workingday  10886 non-null  int64
 4   weather     10886 non-null  int64
 5   temp        10886 non-null  float64
 6   atemp       10886 non-null  float64
 7   humidity    10886 non-null  int64
 8   windspeed   10886 non-null  float64
 9   casual      10886 non-null  int64
 10  registered  10886 non-null  int64
 11  count       10886 non-null  int64
dtypes: float64(3), int64(8), object(1)
memory usage: 1020.7+ KB
bike. datetime = pd. to_datetime( bike. datetime)
bike. dtypes
datetime      datetime64[ns]
season                 int64
holiday                int64
workingday             int64
weather                int64
temp                 float64
atemp                float64
humidity               int64
windspeed            float64
casual                 int64
registered             int64
count                  int64
dtype: object
bike = bike. set_index( 'datetime' )
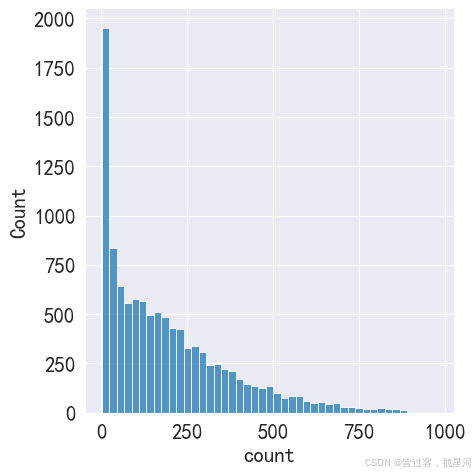
sns. displot( bike[ 'count' ] )
<seaborn.axisgrid.FacetGrid at 0x188cdad03d0>
bike[ "count" ] . describe( )
count    10886.000000
mean       191.574132
std        181.144454
min          1.000000
25%         42.000000
50%        145.000000
75%        284.000000
max        977.000000
Name: count, dtype: float64
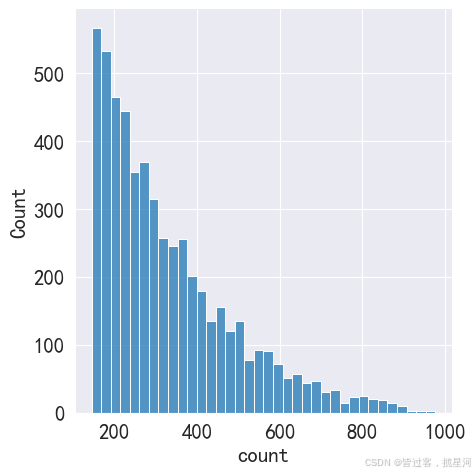
def Count ( x) :
if x < 145 :
return np. nan
else :
return x
bike1 = bike
bike1[ 'count' ] = bike1[ 'count' ] . apply ( Count)
bike1 = bike1. dropna( axis= 0 , how = 'any' )
sns. displot( bike1[ 'count' ] )
<seaborn.axisgrid.FacetGrid at 0x188d2f1f490>
bike = bike1
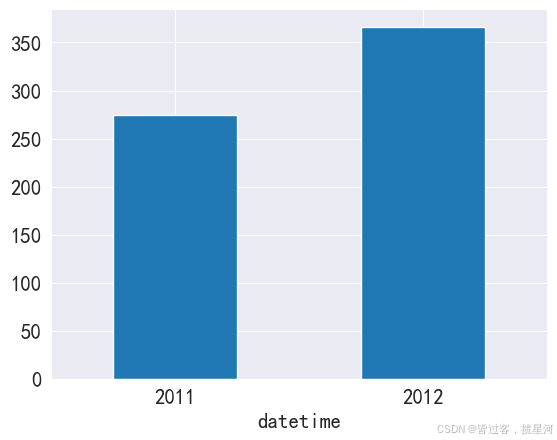
y_bike = bike. groupby( bike. index. year) . mean( ) [ 'count' ]
y_bike
datetime
2011    274.526697
2012    366.408629
Name: count, dtype: float64
y_bike. plot( kind = 'bar' , rot = 0 )
<Axes: xlabel='datetime'>
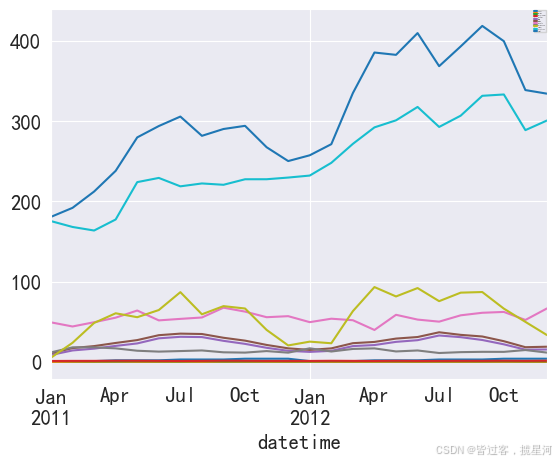
mm_bike = bike. resample( 'M' , kind = 'period' ) . mean( )
mm_bike. head( 10 )
C:\Users\admin.DESKTOP-G6CFGT8\AppData\Local\Temp\ipykernel_3984\4111023337.py:2: FutureWarning: The 'kind' keyword in DataFrame.resample is deprecated and will be removed in a future version. Explicitly cast the index to the desired type instead
  mm_bike = bike.resample('M', kind = 'period').mean()
C:\Users\admin.DESKTOP-G6CFGT8\AppData\Local\Temp\ipykernel_3984\4111023337.py:2: FutureWarning: 'M' is deprecated and will be removed in a future version, please use 'ME' instead.
  mm_bike = bike.resample('M', kind = 'period').mean()
season holiday workingday weather temp atemp humidity windspeed casual registered count datetime 2011-01 1.0 0.000000 1.000000 1.160000 8.692000 10.909600 49.320000 11.880440 5.280000 175.520000 180.800000 2011-02 1.0 0.000000 0.791045 1.283582 14.294925 17.243134 44.179104 18.179100 23.835821 168.208955 192.044776 2011-03 1.0 0.000000 0.666667 1.291667 16.553750 19.728021 49.458333 18.187778 48.583333 163.781250 212.364583 2011-04 2.0 0.078014 0.617021 1.453901 19.970780 23.634752 55.177305 16.893741 60.624113 177.539007 238.163121 2011-05 2.0 0.000000 0.758197 1.446721 23.060820 27.214037 64.069672 13.946627 55.745902 224.110656 279.856557 2011-06 2.0 0.000000 0.692593 1.322222 29.410667 33.319630 51.774074 12.844570 64.659259 229.333333 293.992593 2011-07 3.0 0.052632 0.616541 1.161654 31.304887 35.264624 53.646617 13.537803 86.962406 218.849624 305.812030 2011-08 3.0 0.000000 0.807843 1.290196 30.973490 34.795275 55.388235 14.298194 59.368627 222.450980 281.819608 2011-09 3.0 0.039130 0.613043 1.508696 26.282783 30.112630 67.604348 11.982892 69.530435 220.782609 290.313043 2011-10 4.0 0.062500 0.629464 1.419643 22.491429 26.528795 62.709821 11.607660 66.584821 227.669643 294.254464
mm_bike. plot( )
plt. legend( loc = 'best' , fontsize = 0 )
<matplotlib.legend.Legend at 0x188d2d0cdd0>
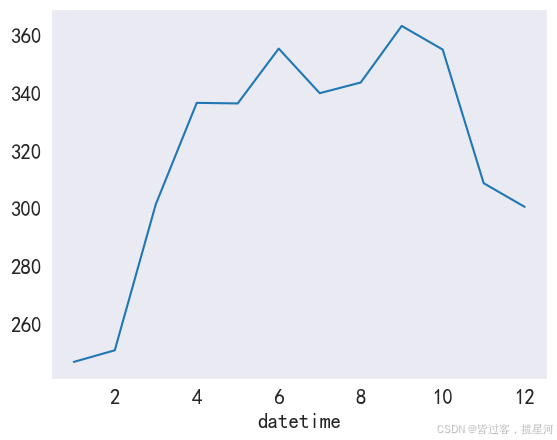
m_bike = bike. groupby( bike. index. month) . mean( ) [ 'count' ]
m_bike. plot( )
plt. grid( )
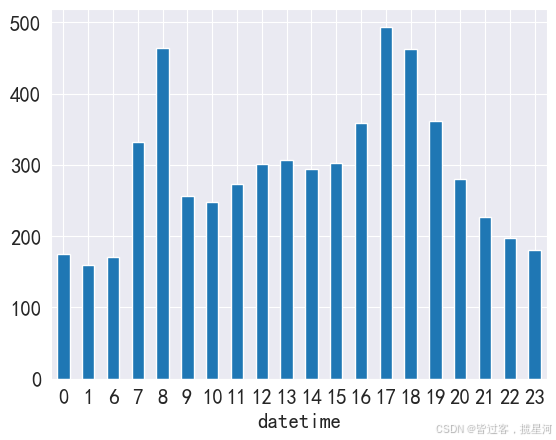
h_bike = bike. groupby( bike. index. hour) . mean( ) [ 'count' ]
h_bike. plot( kind = 'bar' , rot = 0 )
<Axes: xlabel='datetime'>
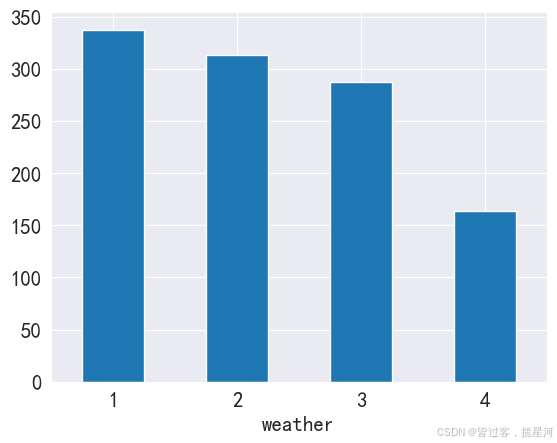
weather_bike = bike. groupby( bike. weather) . mean( ) [ 'count' ]
weather_bike. plot( kind = 'bar' , rot = 0 )
<Axes: xlabel='weather'>
