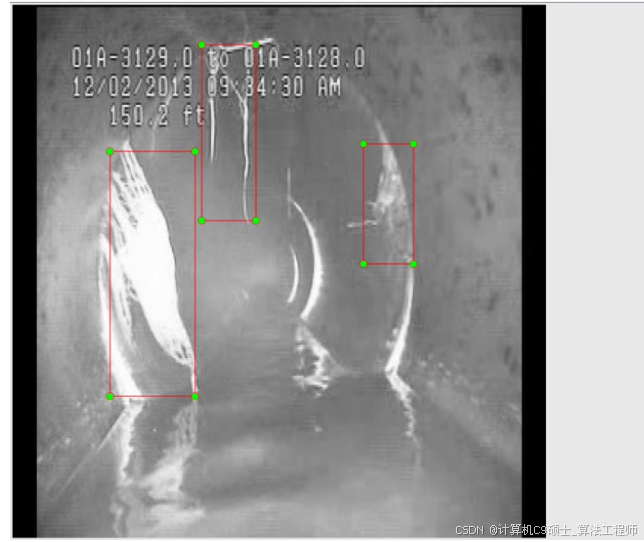
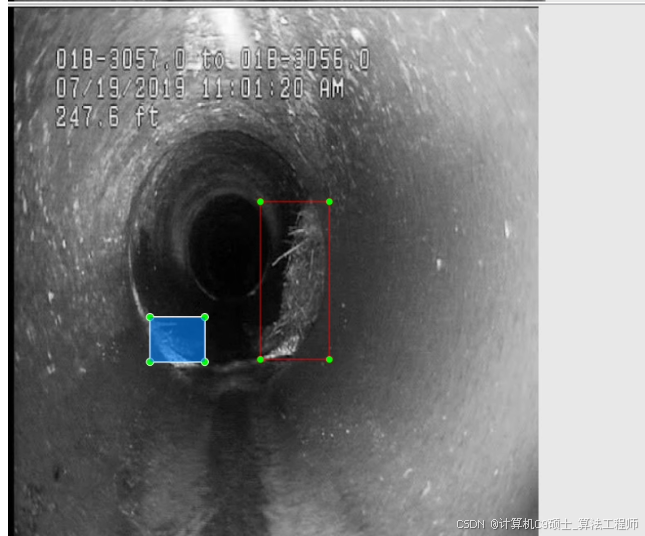
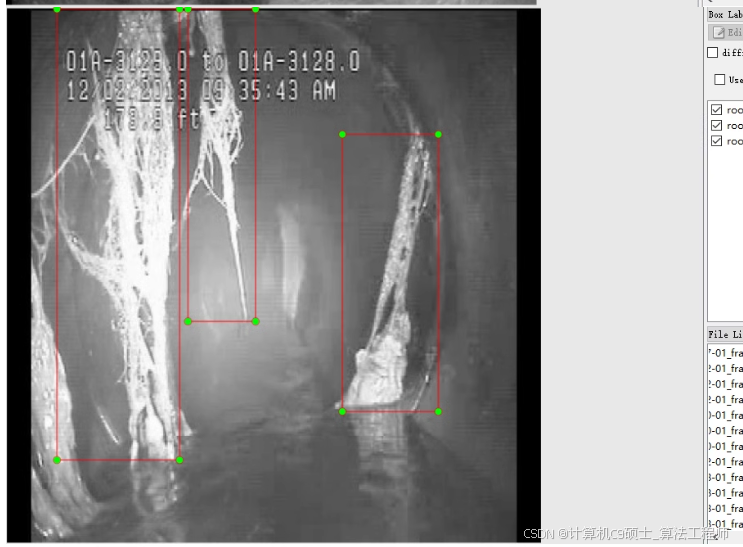
下水管道内植物根茎目标识别检测数据集 yolo数据集 共350张
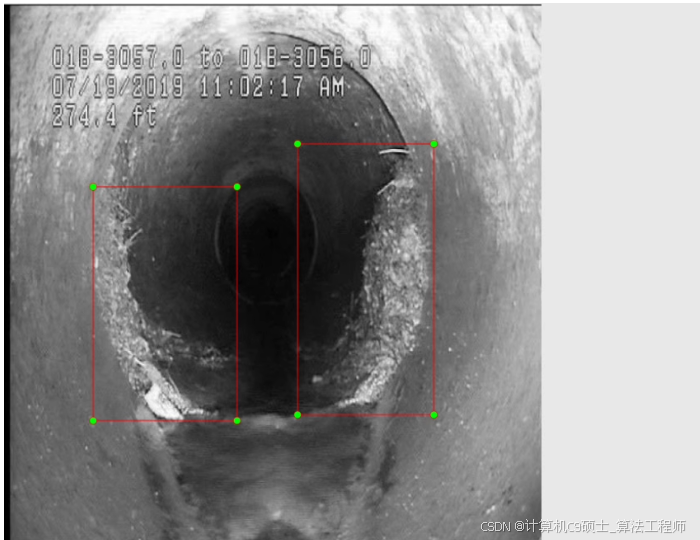
标注名称以及数量:
root
707
1
.txt文件,其中包含了边界框的信息。
数据准备
确保你的数据集已经按照YOLO格式组织好。每个图像都有一个对应的.txt文件,该文件包含边界框信息。每行代表一个对象,格式如下:
class_id center_x center_y width height
所有值都是相对于图像尺寸归一化后的浮点数。假设你的数据集按照以下结构组织:
dataset/
├── images/
│   ├── train/
│   └── val/
├── labels/
│   ├── train/
│   └── val/
└── data.yaml
并且有一个配置文件data.yaml来定义数据集路径和类别信息:
train: ./dataset/images/train/
val: ./dataset/images/val/

nc: 1  # 类别数量
names: ['root']  # 类别名
请根据实际的数据集路径修改上述data.yaml文件中的路径。
安装依赖项
确保你已经安装了YOLOv8及其依赖项。可以从Ultralytics的GitHub仓库获取YOLOv8:
pip install ultralytics
模型训练
使用以下Python脚本开始训练过程:
from ultralytics import YOLO

def main_train():
    # 加载YOLOv8模型,'yolov8n.yaml'表示使用nano版本,你可以选择其他尺寸如's', 'm', 'l', 'x'
    model = YOLO('yolov8n.yaml')  # 或者直接加载预训练权重,例如'ultralytics/yolov8n.pt'

    results = model.train(
        data='./path/to/data.yaml',  # 替换为你的data.yaml路径
        epochs=200,  # 根据需要调整训练周期数
        imgsz=640,  # 图像尺寸
        batch=16,  # 批大小,根据你的硬件条件调整
        project='./runs/detect',
        name='pipe_root_detection',
        optimizer='SGD',
        device='0',  # 使用GPU编号,'0'表示第一个GPU
        save=True,
        cache=True,
    )

if __name__ == '__main__':
    main_train()
注意:因为数据集较小(只有350张图像),可能不需要太长的训练时间(比如200个epoch就足够了)。此外,可以考虑进行数据增强或迁移学习以提高模型性能。
模型评估
训练完成后,可以使用验证集对模型进行评估:
from ultralytics import YOLO

model = YOLO('./runs/detect/pipe_root_detection/weights/best.pt')
metrics = model.val(data='./path/to/data.yaml')
print(metrics.box.map)  # 输出mAP值等指标
推理与可视化
加载训练好的模型进行推理,并可视化结果:
import cv2
from PIL import Image
from ultralytics import YOLO

model = YOLO('./runs/detect/pipe_root_detection/weights/best.pt')

def detect_roots(image_path):
    results = model.predict(source=image_path)
    img = cv2.imread(image_path)
    for result in results:
        boxes = result.boxes.numpy()
        for box in boxes:
            r = box.xyxy
            x1, y1, x2, y2 = int(r[0]), int(r[1]), int(r[2]), int(r[3])
            label = result.names[int(box.cls)]
            confidence = box.conf
            if confidence > 0.5:  # 设置置信度阈值
                cv2.rectangle(img, (x1, y1), (x2, y2), (0, 255, 0), 2)  # 绘制矩形框
                cv2.putText(img, f'{label} {confidence:.2f}', (x1, y1 - 10), cv2.FONT_HERSHEY_SIMPLEX, 0.9, (0, 255, 0), 2)
    return img

# 示例调用
result_image = detect_roots('your_test_image.jpg')
Image.fromarray(cv2.cvtColor(result_image, cv2.COLOR_BGR2RGB)).show()  # 使用PIL显示图像
以上步骤涵盖了从数据准备到模型训练、评估和推理的基本流程。对于小数据集,还可以尝试数据增强技术(如随机裁剪、旋转、翻转等),以增加模型的泛化能力。