Hi,这里是一只殚精竭虑的老鼠屎。最近在处理公交数据,模型效果非常不理想。过程中学习了师兄留下的lstm做的金融数据预测,使用的是keras框架,这里整理一下。这篇博客里面交代了包括数据的处理、模型搭建、模型调参、模型评估等重要环节,十分适合新手入门。师兄留下的jupyter notebook出处不详。
目录
1 准备工作
1.1 引入相关库
import numpy as np
import matplotlib.pyplot as plt
import pandas as pd
from pandas import datetime
import math, time
import itertools
from sklearn import preprocessing
import datetime
from sklearn.metrics import mean_squared_error
from math import sqrt
from keras.models import Sequential
from keras.layers.core import Dense, Dropout, Activation
from keras.layers.recurrent import LSTM
from keras.models import load_model
import keras
import pandas_datareader.data as web
import h5py
from keras.callbacks import EarlyStopping, ModelCheckpoint
1.2 引入参数
stock_name = '^GSPC'
seq_len = 22
d = 0.2
shape = [4, seq_len, 1] # feature, window, output
neurons = [128, 128, 32, 1]
epochs = 300
2 构建模型
2.1 下载数据并正则化
在引入库时,pandas_datareader.data里面有各种金融数据。我们就是从这里下载这次demo用的数据。使用的是1971年至现在的数据。同时,在get_stock_data函数中,我们也使用了scikit-learn中的MinMaxScaler()对数据进行了正则化。
def get_stock_data(stock_name, normalize=True):
    start = datetime.datetime(1971, 1, 1)
    end = datetime.date.today()
    df = web.DataReader(stock_name, "yahoo", start, end)
    df.drop(['Volume', 'Close'], 1, inplace=True)

    if normalize:
        min_max_scaler = preprocessing.MinMaxScaler()
        df['Open'] = min_max_scaler.fit_transform(df.Open.values.reshape(-1,1))
        df['High'] = min_max_scaler.fit_transform(df.High.values.reshape(-1,1))
        df['Low'] = min_max_scaler.fit_transform(df.Low.values.reshape(-1,1))
        df['Adj Close'] = min_max_scaler.fit_transform(df['Adj Close'].values.reshape(-1,1))
    return df

df = get_stock_data(stock_name, normalize=True)
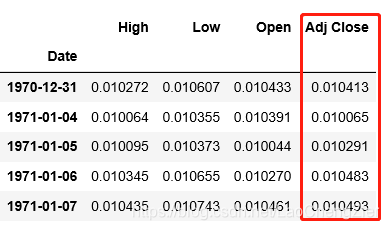
在jupyter notebook中可以使用df.head()看一下正则化好后的数据。这里,Adj Close是我们的标签列,我们预测的是最后一列的数据。
2.2 绘制正则化后的标签数据
def plot_stock(stock_name):
    df = get_stock_data(stock_name, normalize=True)
    print(df.head())
    plt.plot(df['Adj Close'], color='red', label='Adj Close')
    plt.legend(loc='best')
    plt.show()
plot_stock(stock_name)
经过plot_stock后的结果如下图:
2.3 把最后一天的Adjusted Close作为y值
这里使用到了滑窗处理。在最初定义变量时,我们定义seq_len为22,即滑窗的大小为22。在预测时,滑窗拿前21天的数据(包括Adjusted Close)预测第22天的数据。在load_data模块里面,我们定义了滑窗,用result列表将数据放入滑窗内。同时划分了训练集和验证集。
def load_data(stock, seq_len):
    amount_of_features = len(stock.columns)
    data = stock.as_matrix()
    sequence_length = seq_len + 1 # index starting from 0
    result = []

    for index in range(len(data) - sequence_length): # maxmimum date = lastest date - sequence length
        result.append(data[index: index + sequence_length]) # index : index + 22days

    result = np.array(result)
    row = round(0.9 * result.shape[0]) # 90% split

    train = result[:int(row), :] # 90% date
    X_train = train[:, :-1] # all data until day m
    y_train = train[:, -1][:,-1]
