前言
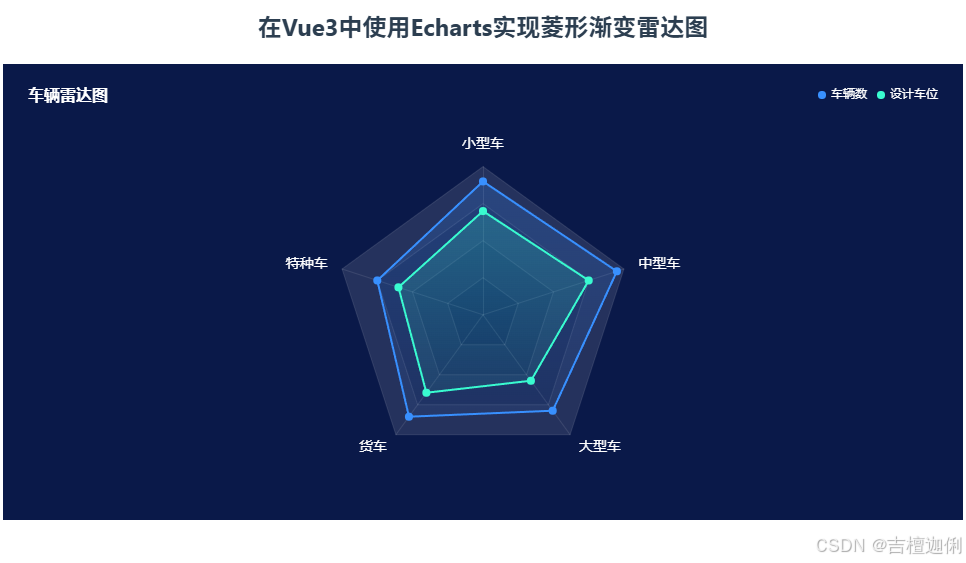
在现代 Web 开发中,数据可视化是一个非常重要的领域。ECharts 是一个功能强大的开源可视化库,支持多种图表类型,包括折线图、柱状图、饼图、雷达图等。结合 Vue 3 的响应式特性,我们可以轻松实现复杂的数据可视化功能。本文将详细介绍如何在 Vue 3 中使用 ECharts 实现菱形渐变雷达图。
技术栈
-
Vue 3:用于构建用户界面。
-
ECharts:用于数据可视化。
-
TypeScript:用于增强代码的可读性和健壮性。
实现步骤
1. 环境准备
首先,确保你已经创建了一个 Vue 3 项目。如果还没有,可以通过以下命令创建一个:
npm create vue@latest然后安装 ECharts:
npm install echarts2. 项目结构
在项目中创建一个组件,例如 RadarChart.vue,用于实现雷达图功能。
3. 代码实现
以下是完整的代码实现:
<!--
 * @Author: 彭麒
 * @Date: 2025/1/8
 * @Email: [email protected]
 * @Description: 此源码版权归吉檀迦俐所有,可供学习和借鉴或商用。
 -->
<template>
  <div class="w-full justify-start flex h-[180px] items-center pl-10">
    <BackButton @click="goBack"/>
  </div>
  <div class="font-bold text-[24px]">在Vue3中使用Echarts实现菱形渐变雷达图</div>
  <div class="chart-container">
    <div ref="chartRef" class="radar-chart"></div>
  </div>
</template>

<script setup lang="ts">
import { ref, onMounted, onUnmounted } from 'vue'
import * as echarts from 'echarts'
import BackButton from "@/views/components/BackButton.vue";
import router from "@/router";
const goBack = () => {
  setTimeout(() => {
    router.push('/Echarts')
  }, 1000)
}
const chartRef = ref<HTMLElement | null>(null)
let chart: echarts.ECharts | null = null

const initChart = () => {
  if (!chartRef.value) return

  chart = echarts.init(chartRef.value)

  const option = {
    backgroundColor: '#0a1949',
    title: {
      text: '车辆雷达图',
      textStyle: {
        color: '#fff',
        fontSize: 16
      },
      left: 20,
      top: 20
    },
    legend: {
      data: ['车辆数', '设计车位'],
      right: 20,
      top: 20,
      textStyle: {
        color: '#fff'
      },
      icon: 'circle',
      itemWidth: 8,
      itemHeight: 8
    },
    radar: {
      indicator: [
        { name: '小型车', max: 100 },
        { name: '特种车', max: 100 },
        { name: '货车', max: 100 },
        { name: '大型车', max: 100 },
        { name: '中型车', max: 100 }
      ],
      shape: 'polygon',
      splitNumber: 4,
      center: ['50%', '55%'],
      radius: '65%',
      nameGap: 15,
      splitArea: {
        areaStyle: {
          color: ['rgba(255, 255, 255, 0.02)', 'rgba(255, 255, 255, 0.05)',
            'rgba(255, 255, 255, 0.08)', 'rgba(255, 255, 255, 0.11)']
        }
      },
      axisLine: {
        lineStyle: {
          color: 'rgba(255, 255, 255, 0.1)'
        }
      },
      splitLine: {
        lineStyle: {
          color: 'rgba(255, 255, 255, 0.1)'
        }
      },
      name: {
        textStyle: {
          color: '#fff',
          fontSize: 14
        }
      }
    },
    series: [
      {
        name: '车辆数据',
        type: 'radar',
        data: [
          {
            value: [90, 75, 85, 80, 95],
            name: '车辆数',
            symbol: 'circle',
            symbolSize: 8,
            lineStyle: {
              width: 2,
              color: new echarts.graphic.LinearGradient(0, 0, 0, 1, [
                { offset: 0, color: '#3890ff' },
                { offset: 1, color: '#3890ff' }
              ])
            },
            areaStyle: {
              color: new echarts.graphic.LinearGradient(0, 0, 0, 1, [
                { offset: 0, color: 'rgba(56, 144, 255, 0.3)' },
                { offset: 1, color: 'rgba(56, 144, 255, 0.1)' }
              ])
            },
            itemStyle: {
              color: '#3890ff'
            }
          },
          {
            value: [70, 60, 65, 55, 75],
            name: '设计车位',
            symbol: 'circle',
            symbolSize: 8,
            lineStyle: {
              width: 2,
              color: new echarts.graphic.LinearGradient(0, 0, 0, 1, [
                { offset: 0, color: '#39fbd0' },
                { offset: 1, color: '#39fbd0' }
              ])
            },
            areaStyle: {
              color: new echarts.graphic.LinearGradient(0, 0, 0, 1, [
                { offset: 0, color: 'rgba(57, 251, 208, 0.3)' },
                { offset: 1, color: 'rgba(57, 251, 208, 0.1)' }
              ])
            },
            itemStyle: {
              color: '#39fbd0'
            }
          }
        ]
      }
    ]
  }

  chart.setOption(option)
}

const handleResize = () => {
  chart?.resize()
}

onMounted(() => {
  initChart()
  window.addEventListener('resize', handleResize)
})

onUnmounted(() => {
  chart?.dispose()
  window.removeEventListener('resize', handleResize)
})
</script>

<style scoped>
.chart-container {
  width: 50%;
  height: 50%;
  min-height: 400px;
  margin-left: 50%;
  margin-top: 20px;
  transform: translateX(-50%);
}

.radar-chart {
  width: 100%;
  height: 100%;
}

@media screen and (max-width: 768px) {
  .chart-container {
    min-height: 300px;
  }
}

@media screen and (max-width: 480px) {
  .chart-container {
    min-height: 250px;
  }
}
</style>
4. 代码详解
4.1 初始化 ECharts 实例
-
使用
echarts.init初始化 ECharts 实例,并绑定到chartRef容器。
4.2 配置雷达图
-
radar.indicator:定义雷达图的维度(如小型车、特种车等)。 -
series.data:定义雷达图的数据系列(如车辆数、设计车位)。 -
lineStyle和areaStyle:使用渐变颜色实现菱形渐变效果。
4.3 响应式处理
-
监听窗口大小变化事件,动态调整图表大小。
5. 运行效果
-
页面加载后,显示一个菱形渐变雷达图,包含两条数据系列(车辆数和设计车位)。
-
窗口大小变化时,图表会自动调整大小。
总结
通过 Vue 3 和 ECharts 的结合,我们可以轻松实现复杂的数据可视化功能。本文详细介绍了如何在 Vue 3 中使用 ECharts 绘制菱形渐变雷达图,并对代码进行了优化和注释。希望这篇博文对你有所帮助,欢迎在评论区交流讨论!
参考文档
希望这篇博文能帮助你在 CSDN 上分享你的技术经验!如果有其他问题,欢迎随时提问!
