引言
仪表盘是一种常见的数据可视化组件,广泛应用于实时数据监控、设备状态显示等场景。在前端开发中,ECharts 是一款强大的图表库,能够轻松地帮助我们实现复杂的图表效果。本文将介绍如何在 Vue 3 项目中,利用 ECharts 来实现一个简单而实用的仪表盘。
项目准备
在开始之前,我们需要确保以下几点:
- 已安装 Vue 3 项目环境。
- 已安装 ECharts 库。
如果你还没有安装 ECharts,可以通过 npm 安装:
npm install echarts --save完整代码
<!--
 * @Author: 彭麒
 * @Date: 2025/1/21
 * @Email: [email protected]
 * @Description: 此源码版权归吉檀迦俐所有,可供学习和借鉴或商用。
 -->
<template>
  <div class="w-full justify-start flex h-[180px] items-center pl-10 bg-[#222939]">
    <BackButton @click="goBack"/>
  </div>
  <div class="font-bold text-[24px] bg-[#222939] text-white">在Vue3中使用Echarts实现仪表盘</div>
  <div class="dashboard-container">
    <div ref="chartRef" class="gauges-chart"></div>
  </div>
</template>

<script setup lang="ts">
import { ref, onMounted, onUnmounted } from 'vue'
import * as echarts from 'echarts'
import BackButton from "@/views/components/BackButton.vue";
import router from "@/router";
const goBack = () => {
  setTimeout(() => {
    router.push('/Echarts')
  }, 1000)
}
const chartRef = ref<HTMLElement | null>(null)
let chart: echarts.ECharts | null = null

const highlight = '#03b7c9'

const demoData = [
  { name: '电压', value: 220, unit: 'V', pos: ['16.6%', '25%'], range: [0, 400] },
  { name: '电流', value: 32, unit: 'A', pos: ['49.8%', '25%'], range: [0, 60] },
  { name: '功率因数', value: 0.9, pos: ['83%', '25%'], range: [0.1, 1.0], splitNum: 9 },
  { name: '有功功率', value: 6.34, unit: 'kW', pos: ['16.6%', '75%'], range: [0, 50] },
  { name: '有功电能', value: 6.28, unit: 'kWh', pos: ['49.8%', '75%'], range: [0, 50] },
  { name: '电网频率', value: 50, unit: 'Hz', pos: ['83%', '75%'], range: [0, 100] }
]

const initChart = () => {
  if (!chartRef.value) return

  chart = echarts.init(chartRef.value)

  const option = {
    backgroundColor: '#222939',
    series: demoData.map(item => [
      // 外围刻度
      {
        type: 'gauge',
        center: item.pos,
        radius: '33.33%',
        splitNumber: item.splitNum || 10,
        min: item.range[0],
        max: item.range[1],
        startAngle: 225,
        endAngle: -45,
        axisLine: {
          show: true,
          lineStyle: {
            width: 2,
            shadowBlur: 0,
            color: [[1, highlight]]
          }
        },
        axisTick: {
          show: true,
          lineStyle: {
            color: highlight,
            width: 1
          },
          length: -5,
          splitNumber: 10
        },
        splitLine: {
          show: true,
          length: -14,
          lineStyle: {
            color: highlight
          }
        },
        axisLabel: {
          distance: -20,
          textStyle: {
            color: highlight,
            fontSize: '14',
            fontWeight: 'bold'
          }
        },
        pointer: {
          show: 0
        },
        detail: {
          show: 0
        }
      },
      // 内侧指针、数值显示
      {
        name: item.name,
        type: 'gauge',
        center: item.pos,
        radius: '30.33%',
        startAngle: 225,
        endAngle: -45,
        min: item.range[0],
        max: item.range[1],
        axisLine: {
          show: true,
          lineStyle: {
            width: 16,
            color: [[1, 'rgba(255,255,255,.1)']]
          }
        },
        axisTick: {
          show: 0
        },
        splitLine: {
          show: 0
        },
        axisLabel: {
          show: 0
        },
        pointer: {
          show: true,
          length: '105%'
        },
        detail: {
          show: true,
          offsetCenter: [0, '100%'],
          textStyle: {
            fontSize: 20,
            color: '#fff'
          },
          formatter: [
            '{value} ' + (item.unit || ''),
            '{name|' + item.name + '}'
          ].join('\n'),
          rich: {
            name: {
              fontSize: 14,
              lineHeight: 30,
              color: '#ddd'
            }
          }
        },
        itemStyle: {
          normal: {
            color: highlight
          }
        },
        data: [{
          value: item.value
        }]
      }
    ]).flat()
  }

  chart.setOption(option)
}

const handleResize = () => {
  chart?.resize()
}

onMounted(() => {
  initChart()
  window.addEventListener('resize', handleResize)
})

onUnmounted(() => {
  chart?.dispose()
  window.removeEventListener('resize', handleResize)
})
</script>

<style scoped>
.dashboard-container {
  width: 100%;
  height: 80%;
  background-color: #222939;
  display: flex;
  align-items: center;
  justify-content: center;
}

.gauges-chart {
  width: 100%;
  height: 100%;
  min-height: 600px;
}

@media screen and (max-width: 768px) {
  .gauges-chart {
    min-height: 400px;
  }
}
</style>
运行效果
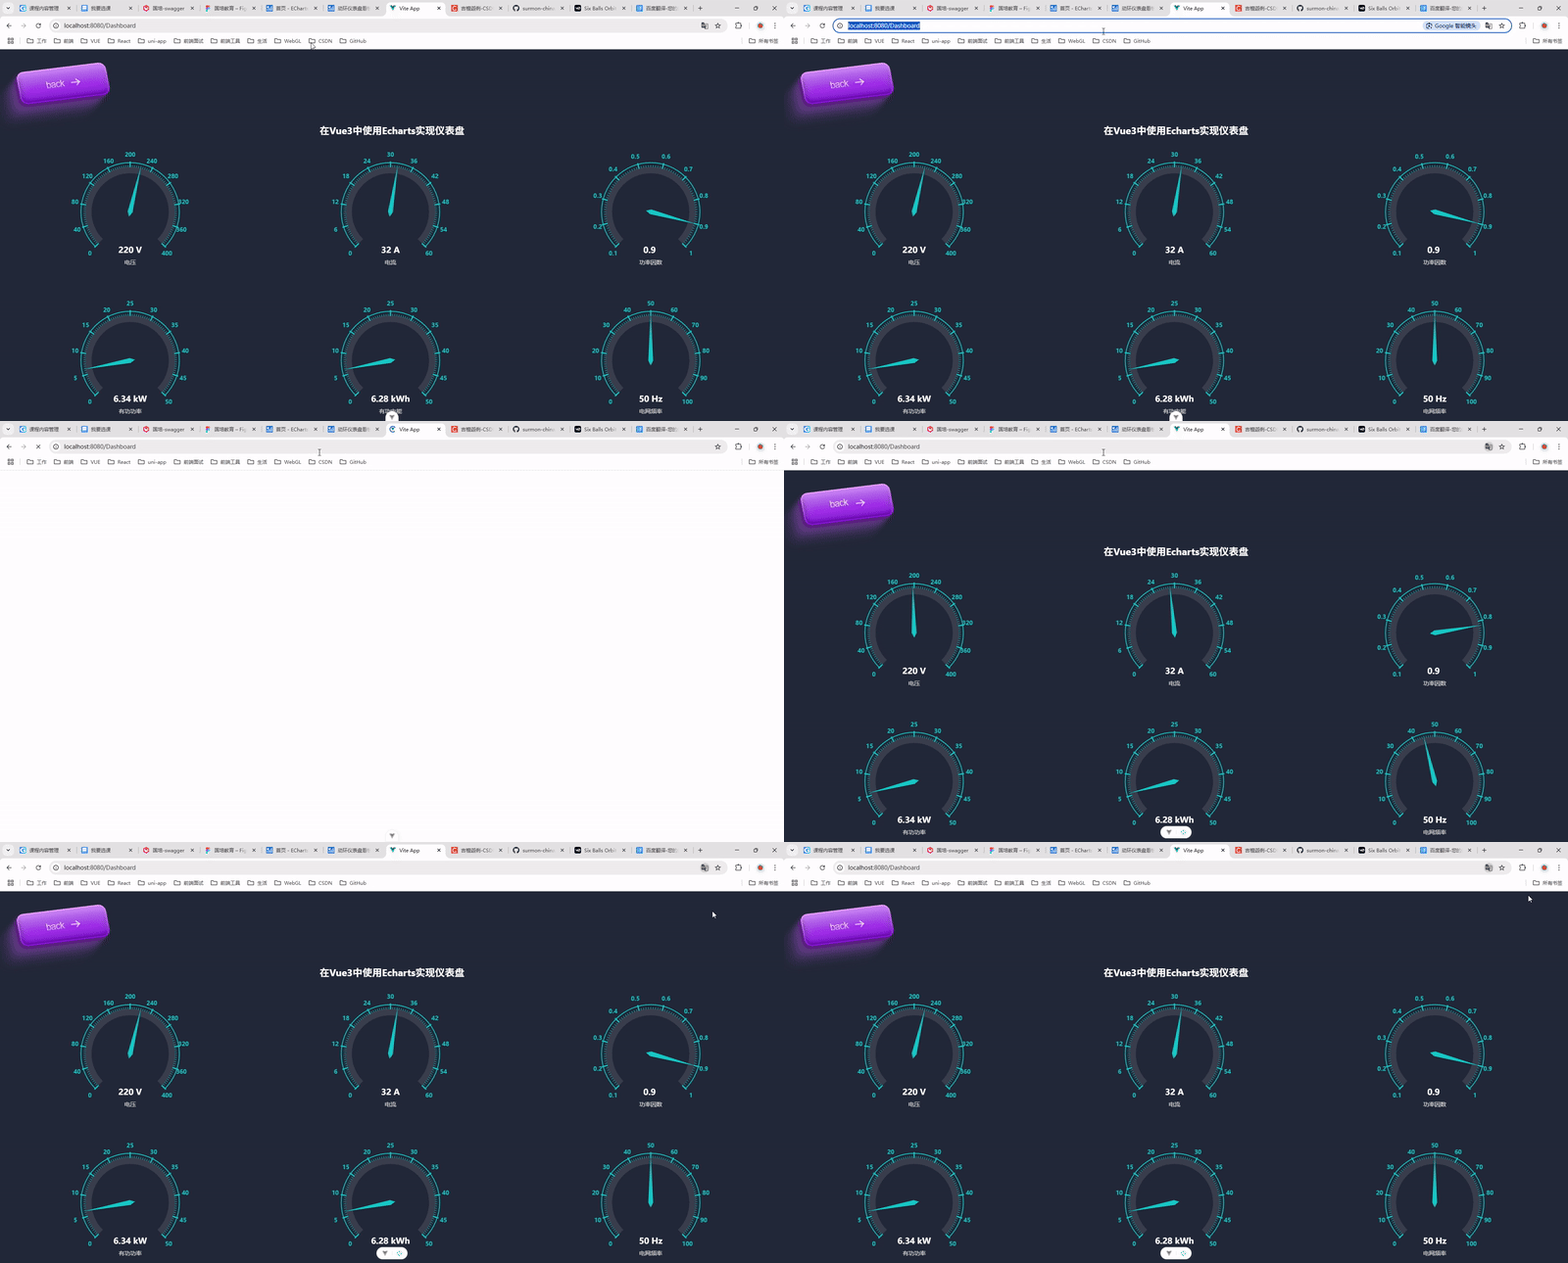
当你将这些代码集成到你的 Vue 3 项目中并运行时,你将看到一个包含多个仪表盘的界面,每个仪表盘显示不同的数据(如电压、电流、功率因数等)。每个仪表盘的数据是通过 ECharts 的 gauge 图表类型来呈现的,同时也使用了颜色和样式定制,以增强视觉效果。
总结
通过本文的示例,你已经学会了如何在 Vue 3 中使用 ECharts 实现一个简单的仪表盘。我们结合了 Vue 3 的 Composition API 和 ECharts 提供的 gauge 图表类型,展示了如何在实际项目中创建动态、可交互的仪表盘。你可以根据需要扩展功能,例如定期更新数据、添加动画效果等。
希望这篇文章对你有所帮助!如果你有任何问题或建议,欢迎在评论区留言。
你可以将这篇文章发布到 CSDN 或其他平台。如果有任何细节需要修改或补充,
