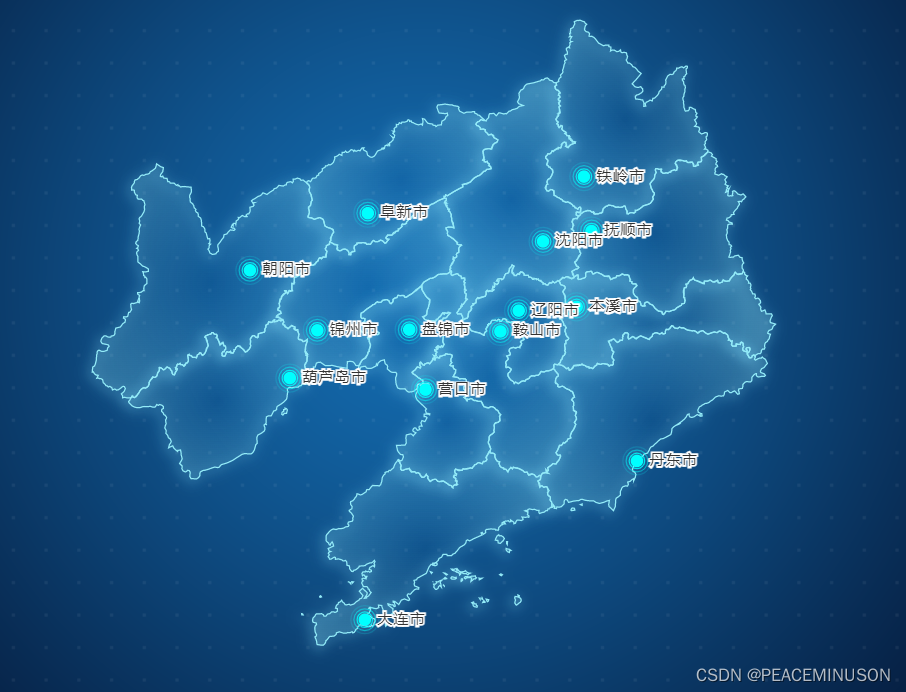
<template>
  <div class="echartsMapAllDemo">
    <!-- style的宽高一定要写,不写也不会展示echarts图 -->
    <div id="myEcharts" ref="myEcharts" :style="{'height': '83vh'}"></div>
    <div class="" v-for="item,index in listArr" :key="index">
      <div class="">{{item}}</div>
    </div>
  </div>
</template>
<script>
import gansuJSon from '../../../static/gansu.json'

export default {

  props: {
    listArr: Array,

  },
  data() {
    return {
      listArr: [],
      gansuJSon,
      // gansuData: [
      //   {
      //     name: '沈阳市', value: [123.429096,
      //       41.796767], bfb: '50', names: '废弃点数量', val: '100', title: '水监测点',
      //   },
      //   {
      //     name: '大连市', value: [121.618622,
      //       38.91459], bfb: '50', names: '废弃点数量', val: '100', title: '水监测点'
      //   },
      //   {
      //     name: '鞍山市', value: [122.995632,
      //       41.110626], bfb: '50', names: '废弃点数量', val: '100', title: '水监测点'
      //   },
      //   {
      //     name: "抚顺市", value: [123.921109,
      //       41.875956], bfb: '50', names: '废弃点数量', val: '100', title: '水监测点'
      //   },
      //   {
      //     name: "本溪市", value: [123.770519,
      //       41.297909], bfb: '50', names: '废弃点数量', val: '100', title: '水监测点'
      //   },
      //   {
      //     name: "丹东市", value: [124.383044,
      //       40.124296], bfb: '50', names: '废弃点数量', val: '100', title: '水监测点'
      //   },
      //   {
      //     name: "锦州市", value: [121.135742,
      //       41.119269], bfb: '50', names: '废弃点数量', val: '100', title: '水监测点'
      //   },
      //   {
      //     name: "营口市", value: [122.235151,
      //       40.667432], bfb: '50', names: '废弃点数量', val: '100', title: '水监测点'
      //   },
      //   {
      //     name: "阜新市", value: [121.648962,
      //       42.011796], bfb: '50', names: '废弃点数量', val: '100', title: '水监测点'
      //   },
      //   {
      //     name: "辽阳市", value: [123.18152,
      //       41.269402], bfb: '50', names: '废弃点数量', val: '100', title: '水监测点'
      //   },
      //   {
      //     name: "盘锦市", value: [122.06957,
      //       41.124484], bfb: '50', names: '废弃点数量', val: '100', title: '水监测点'
      //   },
      //   {
      //     name: "铁岭市", value: [123.844279,
      //       42.290585], bfb: '50', names: '废弃点数量', val: '100', title: '水监测点'
      //   },
      //   {
      //     name: "朝阳市", value: [120.451176,
      //       41.576758], bfb: '50', names: '废弃点数量', val: '100', title: '水监测点'
      //   },
      //   {
      //     name: "葫芦岛市", value: [120.856394,
      //       40.755572], bfb: '50', names: '废弃点数量', val: '100', title: '水监测点'
      //   },
      // ],
    };
  },

  created() {
    console.log('地图父组件传过来的值', this.listArr);
  },
  mounted() {
    this.chinaEcharts();
  },
  methods: {
    chinaEcharts() {
      this.$echarts.registerMap('辽宁', gansuJSon);
      let myChart = this.$echarts.init(this.$refs.myEcharts);

      let option = {
        backgroundColor: "transparent",

        tooltip: {
          // trigger: "item",
          formatter: function (params, ticket, callback) {
            // console.log('params', params);
            let htmlStr = `
                          <div style='font-size:0.09rem;'> ${params.data.title}: ${params.data.bfb}</div>
                          <div style='font-size:0.09rem;'> ${params.data.names}: ${params.data.val}</div>
                        `;
            return htmlStr;
          }"

        },
        //这个属性配置一定要有,要不然无法实现光圈效果
        geo: {
          show: true,
          map: "辽宁",
          label: {
            normal: {
              show: false
            },
            emphasis: {
              show: true
            }
          },
          roam: true,
          itemStyle: {
            normal: {
              borderColor: 'rgba(147, 235, 248, 1)',
              borderWidth: 1,
              areaColor: {
                type: 'radial',
                x: 0.5,
                y: 0.5,
                r: 0.8,
                colorStops: [{
                  offset: 0,
                  color: 'rgba(147, 235, 248, 0)' // 0% 处的颜色
                }, {
                  offset: 1,
                  color: 'rgba(147, 235, 248, .2)' // 100% 处的颜色
                }],
                globalCoord: false // 缺省为 false
              },
              shadowColor: 'rgba(128, 217, 248, 1)',
              // shadowColor: 'rgba(255, 255, 255, 1)',
              shadowOffsetX: -2,
              shadowOffsetY: 2,
              shadowBlur: 10
            },
            emphasis: {
              areaColor: '#389BB7',
              borderWidth: 0
            }
          },

        },
        //series就是地图上的数据(去掉就没有数据了)
        series: [
          //所有的市
          {
            name: "",
            type: "effectScatter",
            coordinateSystem: "geo",
            // data: convertData(gansuData),
            data: this.listArr,
            // symbolSize: function (val) {
            //   return val[2] / 10;
            // },
            //这几个样式一定要加,加上才有那种光圈的效果
            showEffectOn: "render",
            rippleEffect: {
              brushType: "stroke"
            },
            hoverAnimation: true,

            label: {
              formatter: "{b}",
              position: "right",
              show: true
            },
            //圆点的样式
            itemStyle: {
              color: "#00ffff"
            },
            emphasis: {
              label: {
                show: true
              }
            }
          }
        ]
      };
      myChart.setOption(option);
      window.addEventListener("resize", function () {
        myChart.resize();
      });
    }
  }
};
</script>
<style >
</style>
地图JSON生成网址
