一、概述
自相关函数,用来度量同一事件在不同时期之间的相关程度,或者说是一个信号经过类似于反射、折射等其它情况的延时后的副本信号与原信号的相似程度。
R
(
τ
)
=
E
[
(
X
t
−
μ
)
(
X
t
−
τ
−
μ
)
]
σ
2
R(\tau) = \frac{E[(X_t - \mu)(X_{t-\tau} - \mu)]}{\sigma ^ 2}
R(τ)=σ2E[(Xt−μ)(Xt−τ−μ)]
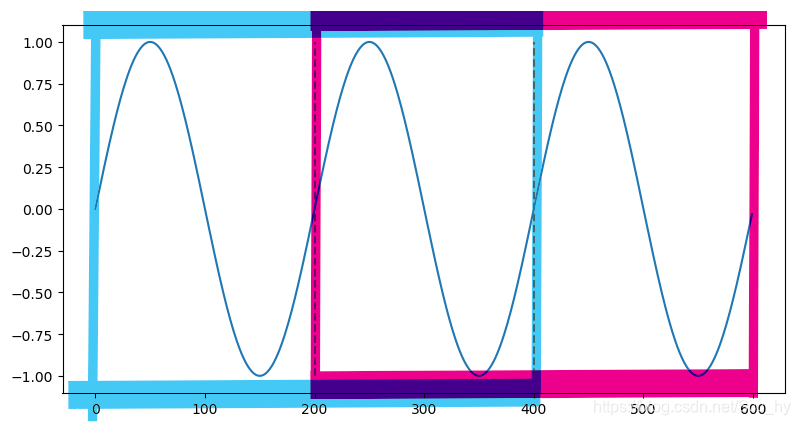
简单讲就是比较不同时间延迟两个序列的相似程度,就好比下图蓝色框内序列和红色框内序列之间的相关性。
二、python实现&statsmodels自带绘制
python绘制
基于公式,计算滞后h的自相关系数
import numpy as np
import matplotlib.pyplot as plt
from numba import jit
from statsmodels.graphics.tsaplots import plot_acf

@jit(nopython=True)
def self_corr(in_arr, h):
    """
    自相关系数:
    E((X_t-u)(X_{t-h} -u))/var(X)
    简单化简了下
    """
    u = np.mean(in_arr)
    s1 = in_arr[h:]
    s2 = in_arr[:-h] if h !=0  else in_arr
    return np.sum((s1 - u) * (s2 - u) / np.sum((in_arr-u)*(in_arr-u)))
基于相关系数,计算每次滞后的自相关系数,并绘制图形
def m_acf_plot(s, lags, ax='no', show_flag=False):
    acf_list = []
    plot_fig = ax
    if ax == 'no':
        plot_fig = plt
        plt.figure(figsize=(10, 6))

    for i in range(0, lags+1):
        p_ = np.round(self_corr(s, i), 5)
        acf_list.append(p_)
        plot_fig.vlines(x=i, ymin=0, ymax=p_, alpha=0.7)

    plot_fig.scatter(list(range(lags+1)), acf_list)
    plot_fig.axhline(y=0, c='steelblue')
    try:
        plot_fig.title('ACF plot')
    except:
        plot_fig.set_title('ACF plot')
    if show_flag:
        plt.show()
    return acf_list
statsmodels绘制及比对
x = np.arange(600) / 100 * np.pi
y = np.sin(x)
fig, axes = plt.subplots(3, 1, figsize=(12, 10))
axes[0].plot(y)
for i in [200, 400]:
    axes[0].vlines(x=i, ymin=-1, ymax=1, linestyle='--', alpha=0.6)

plot_acf(y, ax=axes[1], lags=300)
acf_list=m_acf_plot(y, lags=300, ax=axes[2])
plt.show()
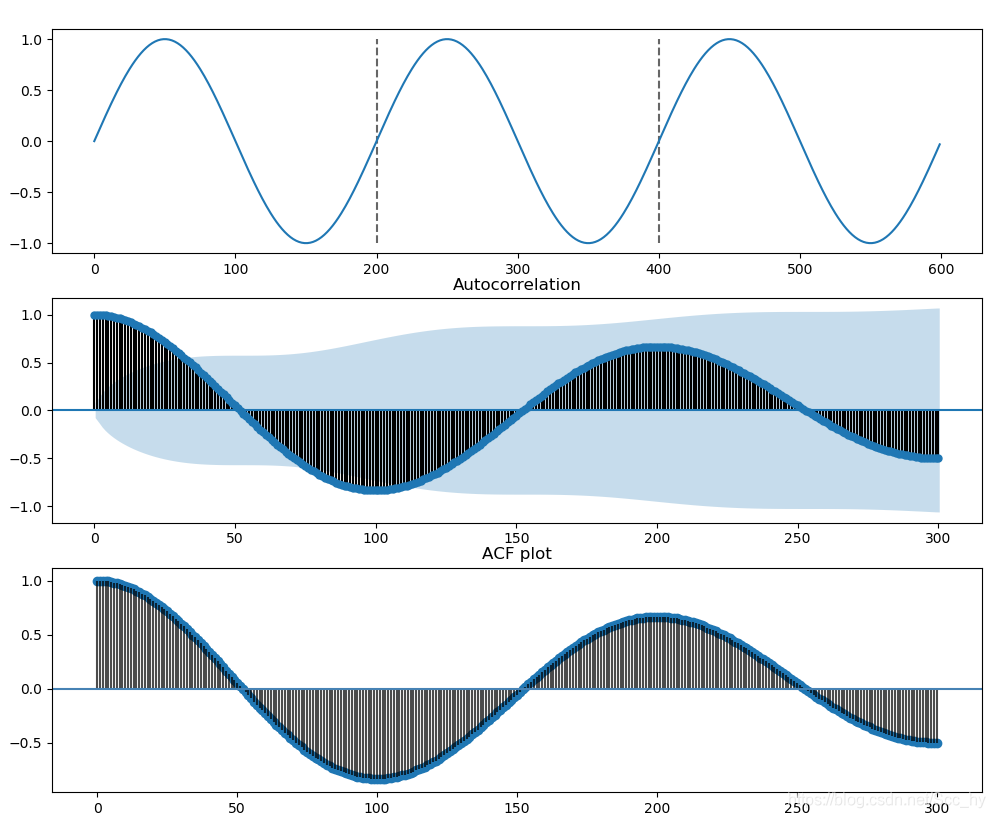
绘制结果如下,可以看出我们绘制的图形与statsmodels的绘制是一致。
三、从ACF中的发现
从上图中我们基本能够看出,序列在经过了200个t滞后和序列的相关又达到了峰值,所以序列的周期大概是200

