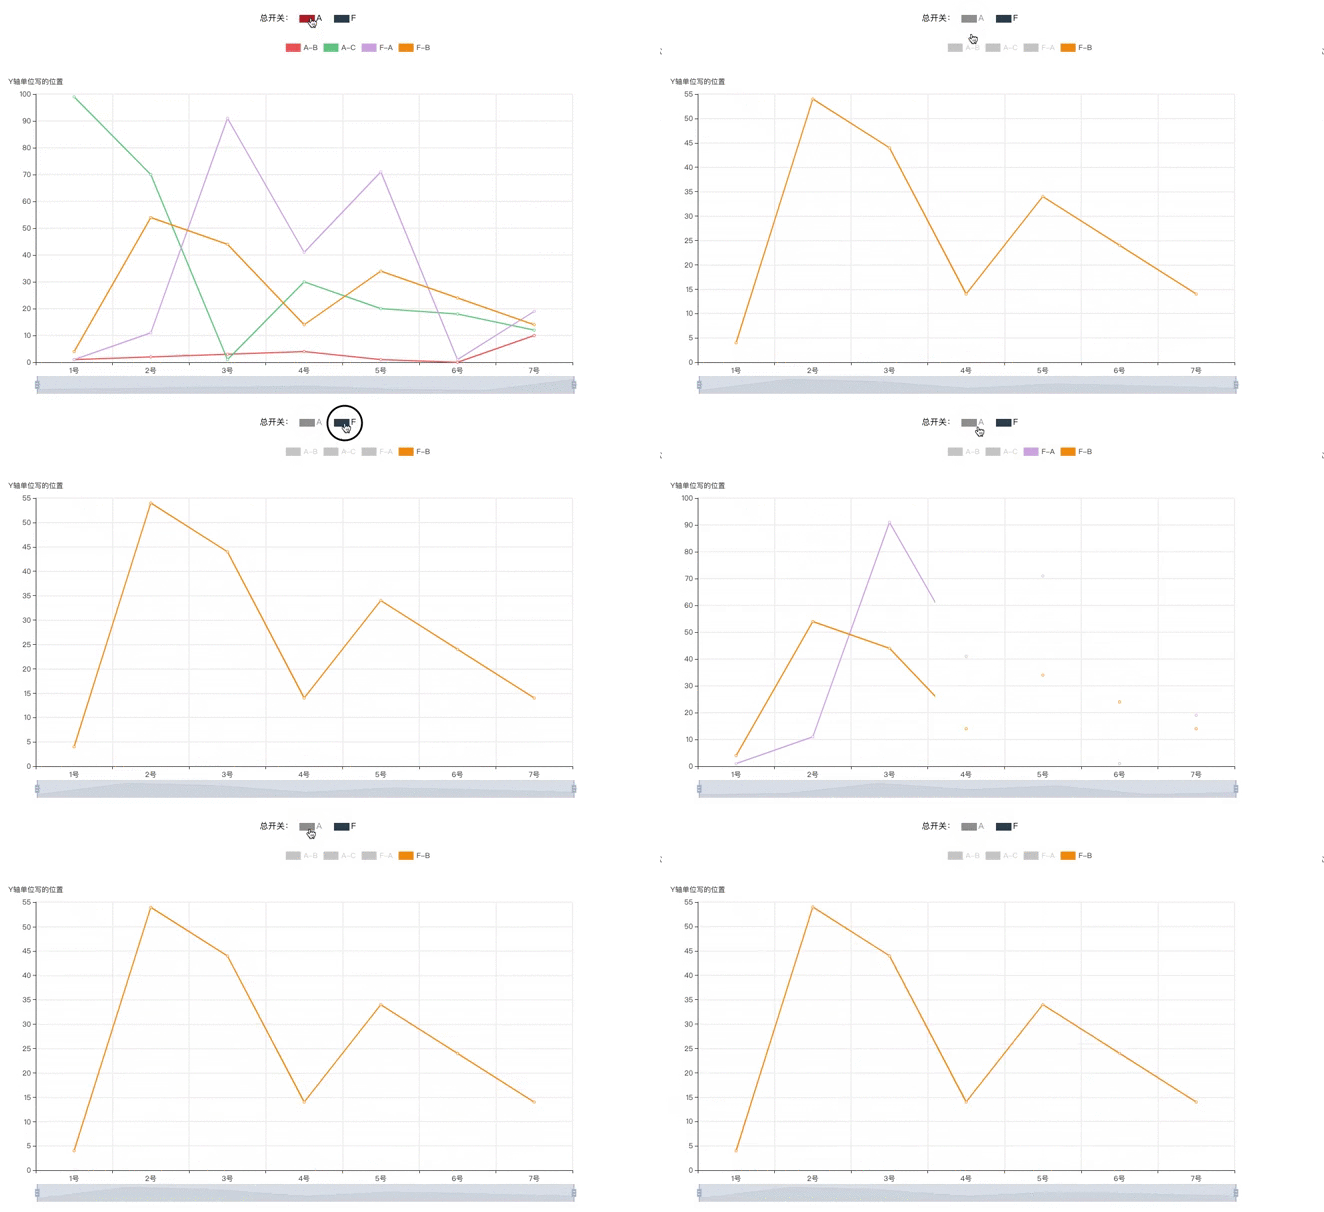
本篇讲解自定义legend 控制多个legend实现方法,具体见代码,并标注注释(例子 文档事例都是有的,传送门?)
<template>
  <div>
    <div class="list">
      总开关:
      <div class="item" v-for="(item,index) in arr" :key="index" :class="{'isSelected': item.isSelect}"
        @click="filter(item)">
        <div class="item-chunk" :style="{background:`${!item.isSelect?item.color:'#999'}`}"></div>
        <div class="item-title">{{item.title}}</div>
      </div>
    </div>
    <div id="main" style="width:1200px;height:600px;"></div>
  </div>
</template>

<script>
import echarts from "echarts";
export default {
  name: "echartsmorey",
  data() {
    return {
      list: [
        {
          x: "1号",
          y: 1,
          z: 99,
          k: 1,
          m: 4
        },
        {
          x: "2号",
          y: 2,
          z: 70,
          k: 11,
          m: 54
        },
        {
          x: "3号",
          y: 3,
          z: 1,
          k: 91,
          m: 44
        },
        {
          x: "4号",
          y: 4,
          z: 30,
          k: 41,
          m: 14
        },
        {
          x: "5号",
          y: 1,
          z: 20,
          k: 71,
          m: 34
        },
        {
          x: "6号",
          y: 0,
          z: 18,
          k: 1,
          m: 24
        },
        {
          x: "7号",
          y: 10,
          z: 12,
          k: 19,
          m: 14
        }
      ],
      dataX: [],
      dataY: [],
      legendData: ["A-B", "A-C", "F-A", "F-B"],
      arr: [
        {
          color: "#c23531",
          title: "A",
          isSelect: false
        },
        {
          color: "#2f4554",
          title: "F",
          isSelect: false
        }
      ]
    };
  },
  methods: {
    filter(code) {
      code.isSelect = !code.isSelect;
      // myChart 的参数
      var options = this.myChart.getOption();
      var selectLegend = options.legend[0];
      for (let key in this.legendData) {
        if (code.isSelect && this.legendData[key].indexOf(code.title) > -1) {
          selectLegend.selected[`${this.legendData[key]}`] = false;
        } else if (this.legendData[key].indexOf(code.title) > -1) {
          selectLegend.selected[`${this.legendData[key]}`] = true;
        }
      }
      this.myChart.setOption(options, true); // 重新渲染该图片
    },
    init(dataX, dataY) {
      this.myChart = echarts.init(document.getElementById("main"));
      let option = {
        color: ["#f87060", "#65bf8a", "#d4b3e4", "#fd9807"], // 自己定义颜色
        legend: {
          icon: "stack",
          data: this.legendData
        },
        tooltip: {
          trigger: "none",
          axisPointer: {
            type: "cross"
          }
        },
        // 工具栏
        toolbox: {
          x: 1100,
          y: 0,
          feature: {
            saveAsImage: {
              name: `test`
            }
          }
        },
        grid: {
          left: "5%", //组件距离容器左边的距离
          right: "20%",
          top: "15%"
        },
        // X轴 滑块 可缩放
        dataZoom: [
          {
            type: "slider",
            show: true,
            start: 0, // 开始百分数
            end: 100 // 结束百分数
          }
        ],
        xAxis: {
          type: "category",
          splitLine: {
            // X 轴分隔线样式
            show: true,
            lineStyle: {
              color: ["#f3f0f0"],
              width: 2,
              type: "solid"
            }
          },
          data: dataX
        },
        yAxis: [
          {
            name: "Y轴单位写的位置",
            type: "value",
            position: "left",
            splitNumber: 10, // Y 轴分隔格数
            splitLine: {
              // Y 轴分隔线样式
              show: true,
              lineStyle: {
                color: ["#f3f0f0"],
                width: 2,
                type: "solid"
              }
            }
          }
        ],
        series: dataY
      };

      this.myChart.on("legendselectchanged", obj => {
        // legend change events
        console.info(234, obj);
      });
      // 使用刚指定的配置项和数据显示图表。
      this.myChart.setOption(option);
    }
  },
  mounted() {
    this.$nextTick(() => {
      this.dataX = this.list.map(item => item.x);
      // 第1个Y轴
      this.dataY.push({
        name: "A-B",
        type: "line", // 直线
        data: this.list.map(item => item.y)
      });
      // 第2个Y轴
      this.dataY.push({
        name: "A-C",
        type: "line",
        data: this.list.map(item => item.z)
      });
      // 第3个Y轴
      this.dataY.push({
        name: "F-A",
        type: "line",
        data: this.list.map(item => item.k)
      });
      // 第3个Y轴
      this.dataY.push({
        name: "F-B",
        type: "line",
        data: this.list.map(item => item.m)
      });

      this.init(this.dataX, this.dataY);
    });
  }
};
</script>

<style scoped lang="scss">
.list {
  display: flex;
  width: 320px;
  margin: 30px auto;
  font-size: 14px;
  .isSelected {
    color: #999;
  }
  .item {
    display: flex;
    margin: 0 10px;
    cursor: pointer;
  }
  .item-title {
    margin-left: 3px;
  }
  .item-chunk {
    height: 13px;
    width: 26px;
    margin-top: 3px;
  }
}
</style>
