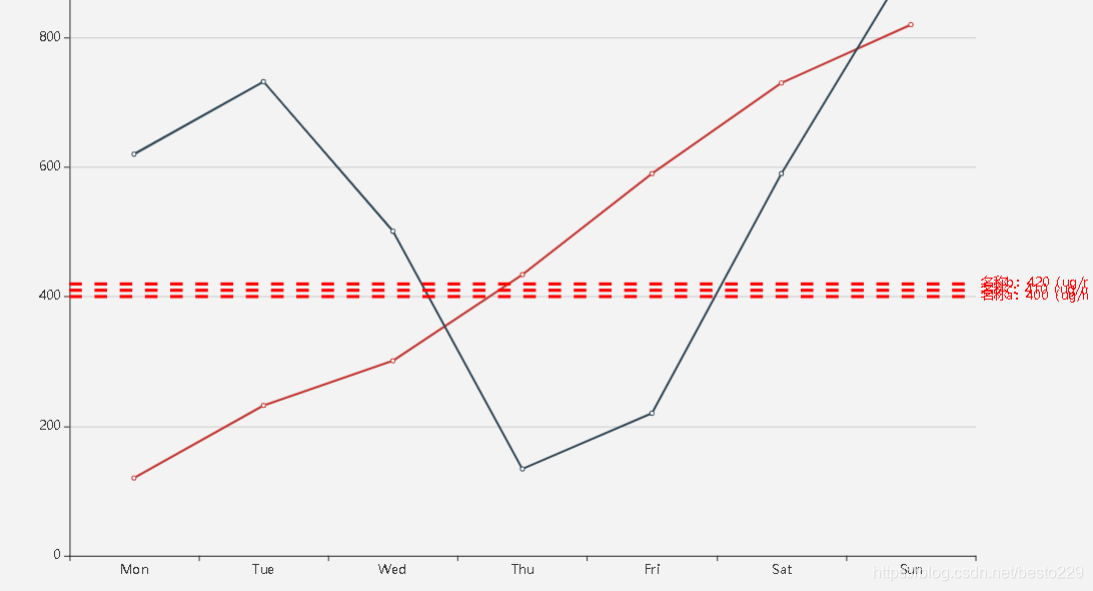
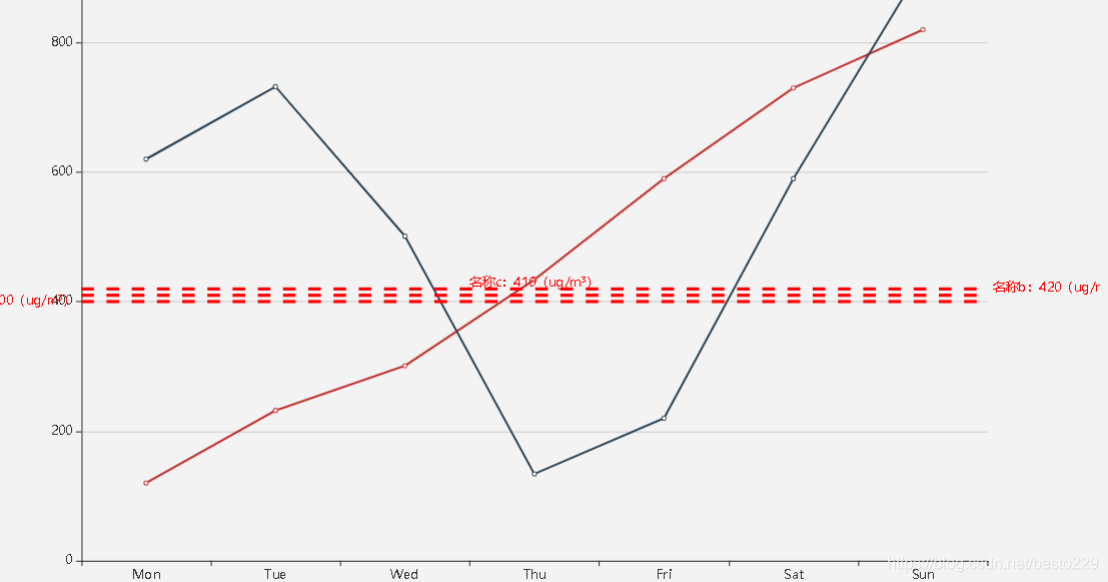
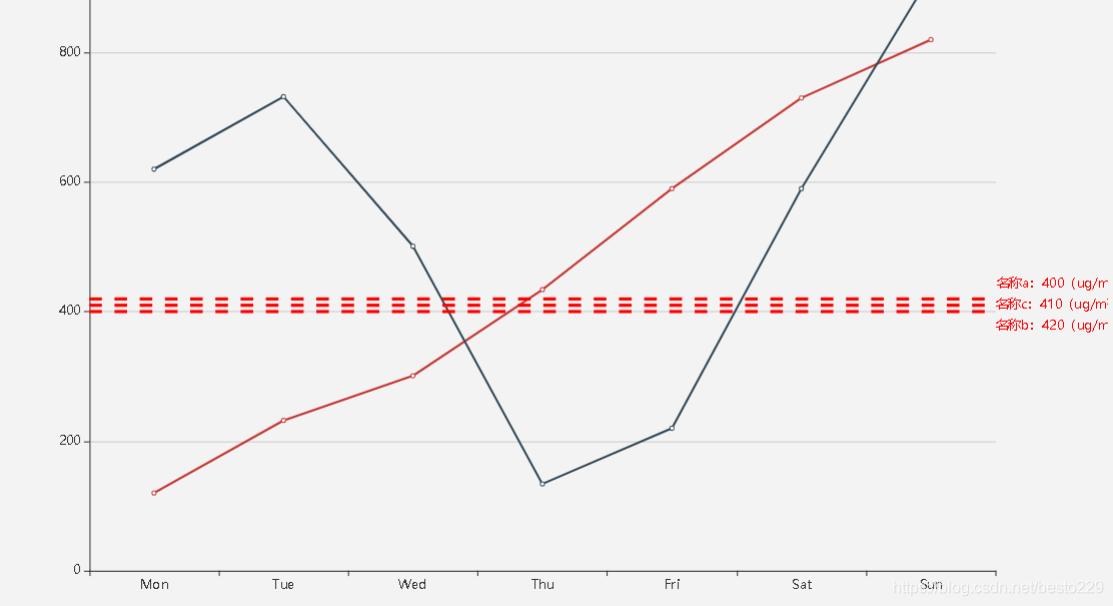
情况如图:
option = {
  xAxis: {
    type: "category",
    data: ["Mon", "Tue", "Wed", "Thu", "Fri", "Sat", "Sun"]
  },
  yAxis: {},
  series: [{
    data: [120, 232, 301, 434, 590, 730, 820],
    type: "line"
  },{
    data: [620, 732, 501, 134, 220, 590, 920],
    type: "line"
  },{
    type: "line",
    markLine: {
      symbol: 'none',
      label: {
        position: 'end',
        formatter: '{b}:{c}(ug/m³)'
      },
      data: [
        {
          name: '名称a',
          yAxis: 400,
          lineStyle: {
            color: 'red',
            type: 'dashed', // 线的类型
            width: 3
          },
          label: {
            color: 'red',
            formatter: '{b}:{c}(ug/m³)'
          }
        },
        {
          name: '名称c',
          yAxis: 410,
          lineStyle: {
            color: 'red',
            type: 'dashed', // 线的类型
            width: 3
          },
          label: {
            color: 'red',
            formatter: '{b}:{c}(ug/m³)'
          }
        },
        {
          name: '名称b',
          yAxis: 420,
          lineStyle: {
            color: 'red',
            type: 'dashed', // 线的类型
            width: 3
          },
          label: {
            color: 'red',
            formatter: '{b}:{c}(ug/m³)'
          }
        }

      ]
    }
  }]
};
1, markLine: series.markLine.label. position
可以通过设置position的值’start’, ‘middle’, ‘end’, 改变标签位置
标线超过3条便不能这样解决。 markLine: series.markLine.label. distance, 这个属性能调整标签与线之间的间距里, 但是这有个坑:position的值’start’, ‘middle’, 'end’时, 标签不能进行上下位置的调整
position的值为’insideStartTop’, ‘insideStartBottom’, ‘insideMiddleTop’, ‘insideMiddleBottom’, ‘insideEndTop’, 'insideEndBottom’时, 可以进行上下位置的调整。
option = {
  xAxis: {
    type: "category",
    data: ["Mon", "Tue", "Wed", "Thu", "Fri", "Sat", "Sun"]
  },
  yAxis: {},
  series: [{
    data: [120, 232, 301, 434, 590, 730, 820],
    type: "line"
  },{
    data: [620, 732, 501, 134, 220, 590, 920],
    type: "line"
  },{
    type: "line",
    markLine: {
      symbol: 'none',
      label: {
        position: 'end',
        formatter: '{b}:{c}(ug/m³)'
      },
      data: [
        {
          name: '名称a',
          yAxis: 400,
          lineStyle: {
            color: 'red',
            type: 'dashed', // 线的类型
            width: 3
          },
          label: {
            position: 'insideEndTop',
            distance: [-125, 20],
            color: 'red',
            formatter: '{b}:{c}(ug/m³)'
          }
        },
        {
          name: '名称c',
          yAxis: 410,
          lineStyle: {
            color: 'red',
            type: 'dashed', // 线的类型
            width: 3
          },
          label: {
            position: 'end',
            distance: [0, 30],
            color: 'red',
            formatter: '{b}:{c}(ug/m³)'
          }
        },
        {
          name: '名称b',
          yAxis: 420,
          lineStyle: {
            color: 'red',
            type: 'dashed', // 线的类型
            width: 3
          },
          label: {
            position: 'insideEndBottom',
            distance: [-125, 20],
            color: 'red',
            formatter: '{b}:{c}(ug/m³)'
          }
        }

      ]
    }
  }]
};
2, markArea: series.markArea.label. position
option = {
  xAxis: {
    type: "category",
    data: ["Mon", "Tue", "Wed", "Thu", "Fri", "Sat", "Sun"]
  },
  yAxis: {},
  series: [{
    data: [820, 932, 901, 934, 1290, 1330, 1320],
    type: "line"
  },{
    data: [320, 432, 101, 634, 1290, 830, 1120],
    type: "line"
  },{
    type: "line",
    markArea: {
     // silent: false,
      data: [
        [
          {
            yAxis: 400,
          },
          {
            yAxis: 400,
            name: '预警值',
            itemStyle: {
              borderColor: 'red',
              borderType: 'dashed',
              borderWidth: 3
            },
            label: {
              position: 'right',
              offset: [10, 20],
              color: 'red',
              formatter: '{b}:{c}(ug/m³)'
            },
            value: '400'
          }
        ],
        [
          {
            yAxis: 810,
          },
          {
            yAxis: 810,
            name: '预警值',
            itemStyle: {
              borderColor: 'red',
              borderType: 'solid',
              borderWidth: 3
            },
            label: {
              show: true,
              position: ['100%', '10'],
              color: 'red',
              formatter: '{b}:{c}(ug/m³)'
            },
            value: '800'
          }
        ]

      ]
    }
  }]
};


