目录
前言
大家好!我是架构筑梦的Cherry,本期跟大家分享的知识是 pandas 数据结构——DataFrame。
作者的【 Python智能工坊】专栏及【少儿编程Python:趣味编程,探索未来】正在火热更新中🔥🔥🔥,如果本文对您有帮助,欢迎大家点赞 + 评论 + 收藏 !
1. DataFrame数据清洗
在Python中,使用pandas库处理DataFrame时,高效的数据清洗是数据预处理的关键步骤之一。以下是一些高效的数据清洗技巧:
1.1 处理缺失值(NaNs)
在现实世界中,数据大多是杂乱无章的;它有多种形式和形状,并且有许多缺失值。有趣的是,根据 IBM Data Analytics 的数据,数据科学家花费高达 80% 的时间来查找、清理和组织数据。幸运的是,pandas 提供了许多强大、快速和高效的方法来检测、删除和替换 pandas DataFrame 中的大量缺失值。
以下是处理缺失值的数据处理流程:
- 利用 pandas 读取.csv文件并将数据存储在 DataFrame 中,
- 查找具有 null 值或缺失值的行和列,
- 计算每列缺失值的总数,
- 使用dropna()方法删除包含 null 值或缺失值的行,
- 利用 .fillna()方法填充缺失值,可以用常数、平均值、中位数、众数等填充。
1.1.1 数据准备
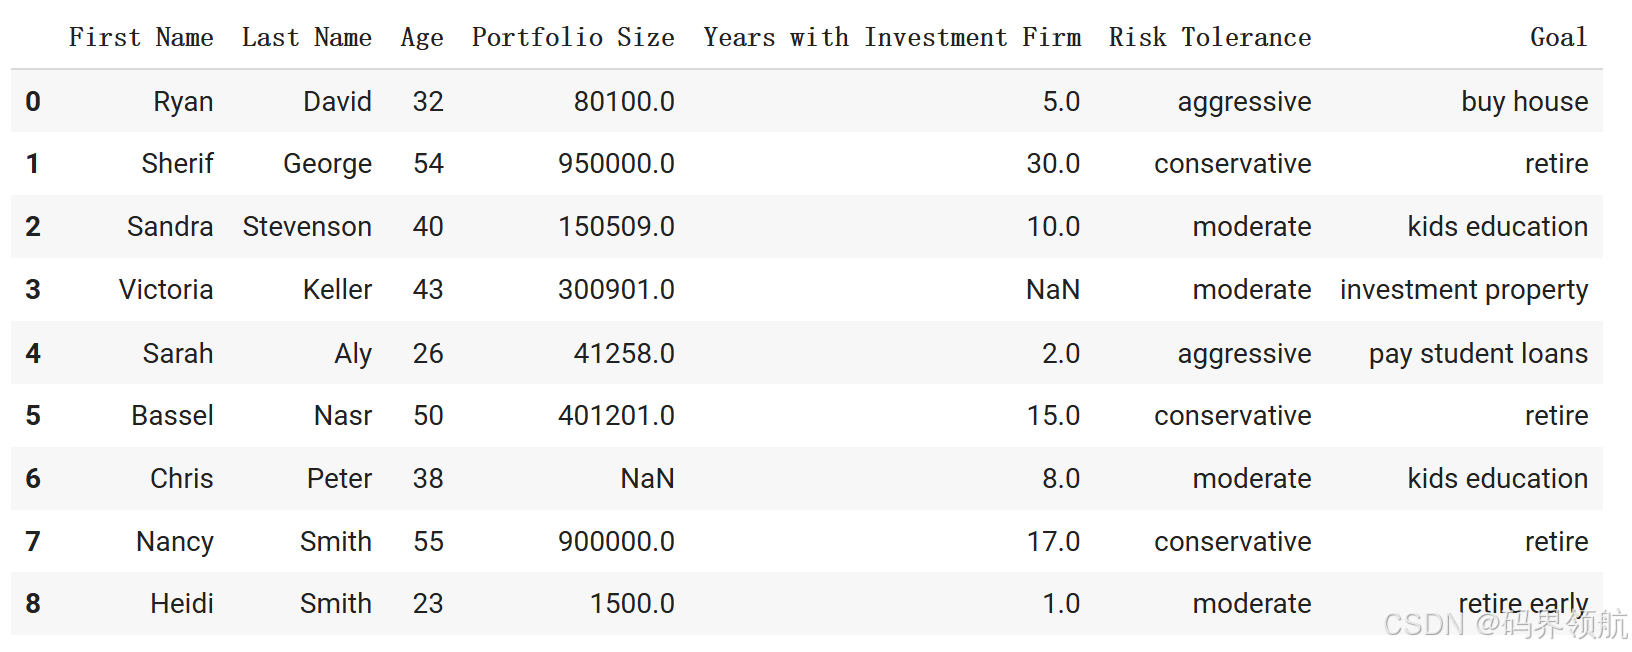
准备一个csv文件,文件名:investors_data.csv,内容如下:
	First Name	Last Name	Age	Portfolio Size	Years with Investment Firm	Risk Tolerance	Goal
0	Ryan	David	32	80100.0	5.0	aggressive	buy house
1	Sherif	George	54	950000.0	30.0	conservative	retire
2	Sandra	Stevenson	40	150509.0	10.0	moderate	kids education
3	Victoria	Keller	43	300901.0	NaN	moderate	investment property
4	Sarah	Aly	26	41258.0	2.0	aggressive	pay student loans
5	Bassel	Nasr	50	401201.0	15.0	conservative	retire
6	Chris	Peter	38	NaN	8.0	moderate	kids education
7	Nancy	Smith	55	900000.0	17.0	conservative	retire
8	Heidi	Smith	23	1500.0	1.0	moderate	retire early
1.1.2 读取数据
import pandas as pd

# 创建一个包含缺失值的DataFrame
investor_df = pd.read_csv('investors_data.csv')
investor_df
输出:
1.1.3 查找具有 null 值或缺失值的行和列
# Let's locate rows and columns that have Null values
# isnull() method returns a new DataFrame containing "True" in Null locations and "False" otherwise
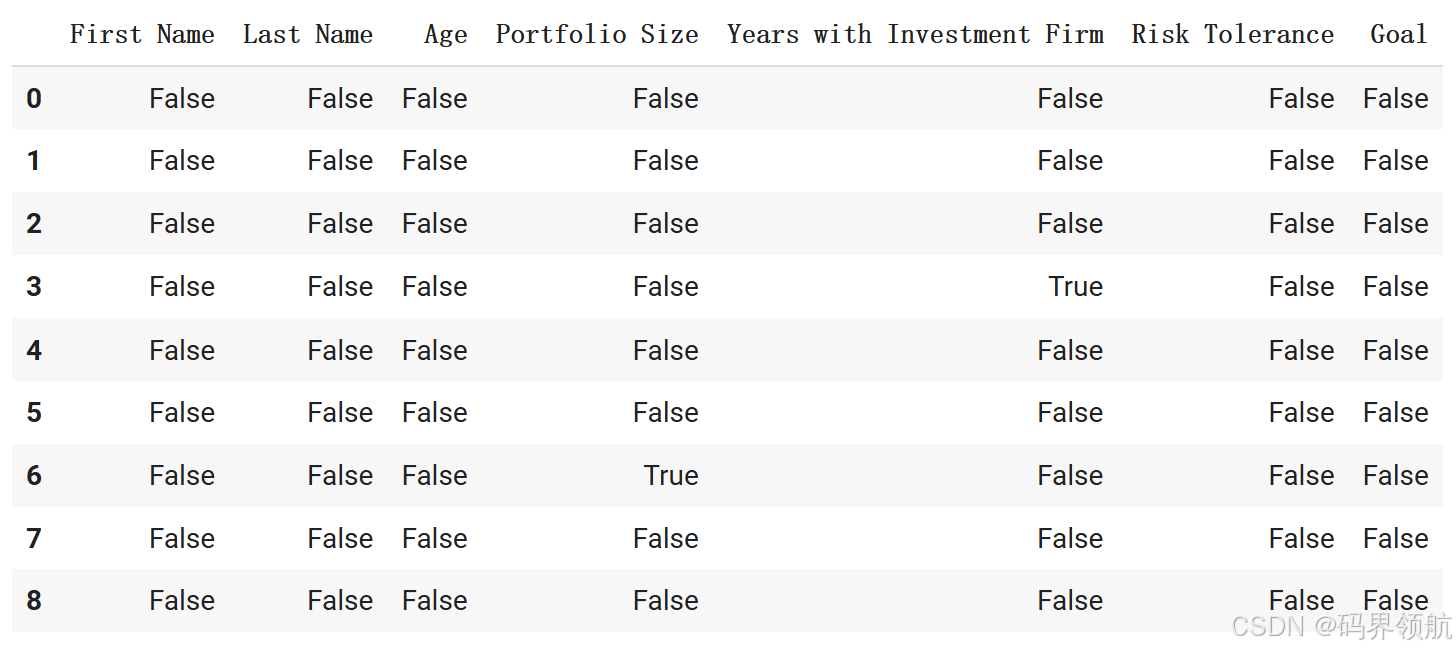
investor_df.isnull()
输出:
1.1.4 计算每列缺失值的总数
# Let's see the total number of missing elements per column
investor_df.isnull().sum()
输出:
First Name                    0
Last Name                     0
Age                           0
Portfolio Size                1
Years with Investment Firm    1
Risk Tolerance                0
Goal                          0
dtype: int64
1.1.5 删除包含 null 值或缺失值的行
# Drop any row that contains a Null value
# Note that the size of the dataframe has been reduced
investor_df.dropna(how = 'any', inplace = True)
# Notice that rows 3 and 6 no longer exist!
investor_df
输出:
# Let's check if we still have any missing values
investor_df.isnull().sum()
输出:
First Name                    0
Last Name                     0
Age                           0
Portfolio Size                0
Years with Investment Firm    0
Risk Tolerance                0
Goal                          0
dtype: int64
1.1.6 利用 .fillna() 方法用Portfolio Size的均值填充Portfolio Size缺失的单元格
# Let's explore an alternative (smarter) method to deal with missing values
# Let's read the raw data again using Pandas as follows
investor_df_temp = pd.read_csv('investors_data.csv')
investor_df_temp

# Let's obtain a statistical summary using "describe()" method
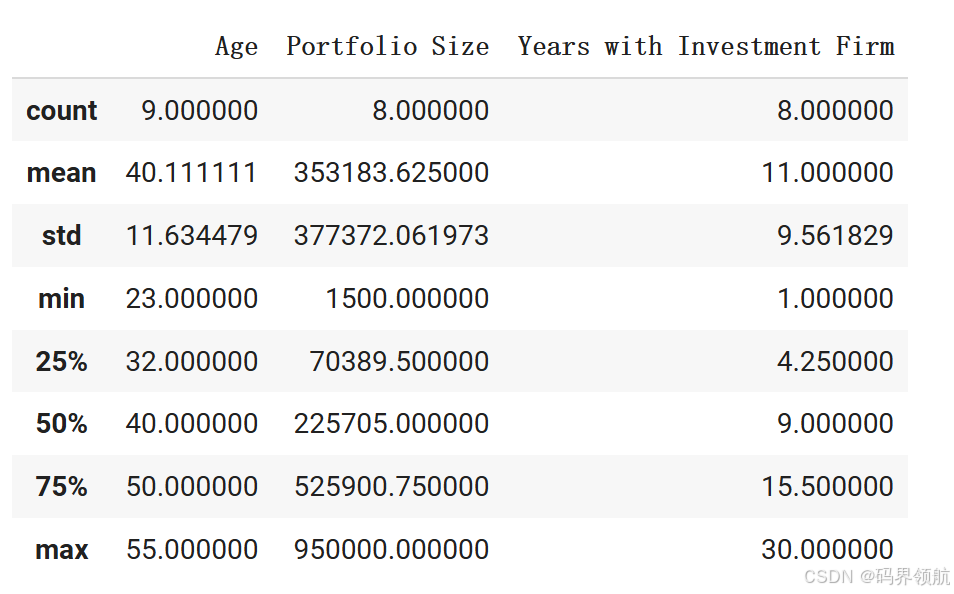
investor_df_temp .describe()
输出:
# Calculate the average portfolio size
investor_df_temp ['Portfolio Size'].mean()
输出:353183.625
# You can use .fillna() to fill missing locations with a certain value
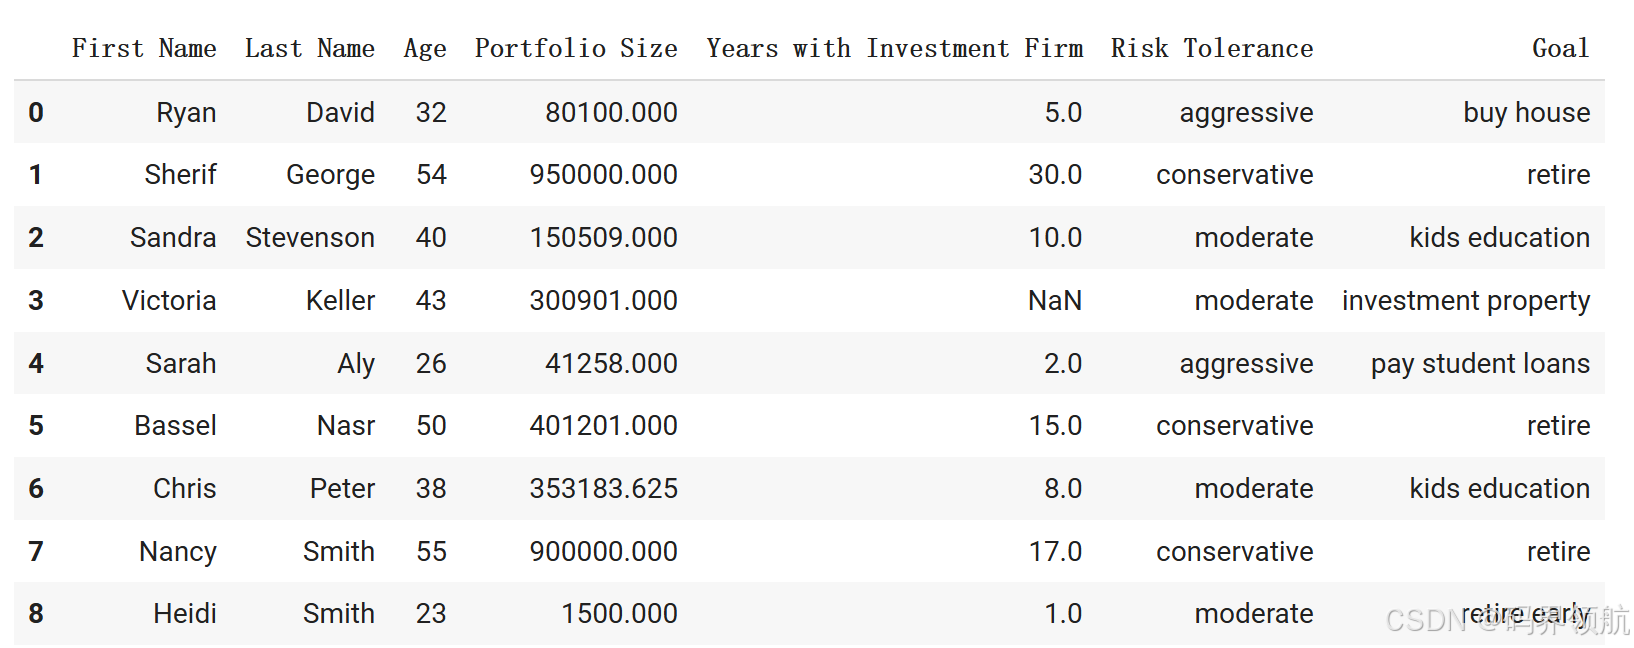
investor_df['Portfolio Size'].fillna(investor_df_temp ['Portfolio Size'].mean(), inplace = True)

investor_df
输出:
1.2 处理重复数据
# 找出重复的行
duplicates = investor_df.duplicated()
print("重复的行:")
print(duplicates)

# 删除重复的行
df_no_duplicates = investor_df.drop_duplicates()
print("\n删除重复的行后:")
print(df_no_duplicates)
1.3 数据类型转换
# 假设有一列是字符串类型的数字,我们需要转换为整数
df['A'] = df['A'].astype(int)
print("列A转换为整数类型:")
print(df)
1.4 字符串处理
# 假设我们有一个包含文本数据的列,需要转换为小写并去除空格
df['text'] = df['text'].str.lower().str.strip()
print("文本列转换为小写并去除空格:")
print(df[['text']])
1.5 数据筛选
# 使用布尔索引筛选数据
filtered_df = df[df['A'] > 2]
print("筛选列A的值大于2的行:")
print(filtered_df)

# 使用query方法进行查询
filtered_df_query = df.query('A > 2')
print("\n使用query方法筛选列A的值大于2的行:")
print(filtered_df_query)
1.6 数据分组与聚合
# 按列B的值进行分组,并计算列A的平均值
grouped = df.groupby('B')['A'].mean()
print("按列B分组并计算列A的平均值:")
print(grouped)
1.7 日期时间处理
# 假设有一个包含日期字符串的列
df['date'] = pd.to_datetime(df['date_str'], format='%Y-%m-%d')
print("字符串转换为日期时间对象:")
print(df[['date']])

# 提取年份
df['year'] = df['date'].dt.year
print("\n提取年份:")
print(df[['year']])
请注意,上述示例中的df和date_str列是假设存在的,你需要根据你的实际数据来替换它们。同样,日期时间格式’%Y-%m-%d’也应该根据你的数据格式进行调整。
2. DATAFRAME 过滤和排序
数据排序是将数据组织成某种有意义的顺序以使其更易于理解和检查的过程。您可以按升序或降序对数据进行排序。例如,数据分析师可能需要根据其投资组合的规模按升序对客户数据进行排序。
与其他数据操作工具相比,Pandas具有关键优势,因为它可以处理大量数据,允许流程自动化,并提供高效的数据操作功能。
# Pandas is a data manipulation and analysis tool that uses a data structure known as DataFrame.
# DataFrames empower programmers to store and manipulate data in a tabular fashion (rows & columns).
# Import Pandas Library into the current environment
# "pd" is an alias of "Pandas"
import pandas as pd

# Pandas is used to read a csv file and store data in a DataFrame
investor_df = pd.read_csv('investors_data.csv')
investor_df

# Select Loyal clients who have been with the investment firm for at least 15 years
loyal_df = investor_df[ investor_df['Years with Investment Firm'] >=15  ]
loyal_df
# You might need to reset the index for the new Pandas DataFrame
loyal_df.reset_index(inplace = True)
loyal_df
df.sort_values(by=‘ColumnName’, ascending=False, inplace=True)
# You can sort the values in the dataframe according to the portfolio size
investor_df.sort_values(by = 'Portfolio Size')
# Let's display the Pandas DataFrame again
# Notice that nothing has changed in memory! you have to make sure that inplace is set to True
investor_df
# Set inplace = True to ensure that change has taken place in memory
investor_df.sort_values(by = 'Portfolio Size', inplace = True)
# Note that now the change (ordering) took place
investor_df
3. 数据帧和函数
回想一下,函数是执行特定任务的代码块。调用函数时执行;您可以向它发送数据,它会返回结果。
我们可以使用 .apply() 函数将函数应用于 pandas DataFrame 中的特定元素。您可以选择应用 Python 内置函数,例如 sum()、min() 或 max(),或使用您创建的任何自定义函数。
定义一个 Python 函数,
在 pandas DataFrame 中沿轴应用自定义函数,然后
将 Python 内置函数应用于 pandas DataFrames。
# Pandas is a data manipulation and analysis tool that uses a data structure known as DataFrame.
# DataFrames empower programmers to store and manipulate data in a tabular fashion (rows & columns).
# Import Pandas Library into the current environment
# "pd" is an alias of "Pandas"
import pandas as pd
import numpy as np
# Pandas is used to read a csv file and store data in a DataFrame
investor_df = pd.read_csv('investors_data.csv')
investor_df
# Define a function that increases the value of x by 10%
def portfolio_update(x):
    return x * 1.1 # assume that portfolio increased by 10%
# You can apply a function to the DataFrame column and add the results to a new column titled "Updated portfolio Size"
investor_df['Updated Portfolio Size'] = investor_df['Portfolio Size'].apply(portfolio_update)
investor_df
# You can also use Python built-in functions as well
investor_df['Sqrt Amount'] = investor_df['Age'].apply(np.sqrt)
investor_df
4. DATAFRAMES 串联和合并
在现实世界中,数据来自不同的来源,并且通常存在于许多单独的文件中。我们经常希望将这些文件合并到一个 pandas DataFrame 中,以进一步分析数据或训练机器学习模型。方便的是,pandas 提供了许多组合 DataFrame 的方法,包括合并和串联。
使用 pandas concat 函数执行 DataFrame 串联,
使用 pandas merge 函数基于给定列执行 DataFrame 合并,以及
使用 .reset_index() 方法重置 pandas DataFrame 索引。
# Pandas is a data manipulation and analysis tool that uses a data structure known as DataFrame.
# DataFrames empower programmers to store and manipulate data in a tabular fashion (rows & columns).
# Import Pandas Library into the current environment
# "pd" is an alias of "Pandas"
import pandas as pd
# Read the first excel sheet into a Pandas DataFrame
investor_1_df = pd.read_csv('investors_group_1.csv')
investor_1_df
# Read the second excel sheet into a Pandas DataFrame
investor_2_df = pd.read_csv('investors_group_2.csv')
investor_2_df
# Let's concatenate both dataframes #1 and #2
investor_df_combined = pd.concat([investor_1_df, investor_2_df])
investor_df_combined
# Note that index need to be reset, you can achieve this using df.reset_index()
# drop = True is used to drop the index column after reset_index() operation is performed
investor_df_combined.reset_index(drop = True)
# Let's assume we acquired new information such as investors salaries and job titles
investor_new_df = pd.read_csv('investors_new_information.csv')
investor_new_df
# Let's merge data on 'Investor ID'
investor_df = pd.merge(investor_df_combined, investor_new_df, on = 'Investor ID')
investor_df
5. 获取金融市场数据
使用 yfinance 获取市场财务数据。yfinance是一个开源工具,用于从雅虎获取市场数据。我们将利用 ticker() 模块,它使任何人都能以简单的方式获取股票、加密货币和 ETF 的市场数据和元数据。
在本课中,您将学习:
使用yfinance工具获取金融市场数据,如股价、贝塔系数、每股收益(EPS)、资产负债表、损益表等;
利用现有方法来显示股票的已付股息、股票分割以及分析师的评级和建议;和
获取加密货币数据,例如收盘价和流通供应量。
# yfinance is an open-source tool used to get market data from Yahoo
# Let's install the library
!pip install yfinance

# Let's import the library
import yfinance as yf

# Pandas is used for dataframe and tabular data manipulation
import pandas as pd
# Using Yahoo Finance tool to fetch all data related to stock of interest
# Note that data is obtained in an object, we can then apply methods to get specific data from the object
# Note that the output is returned in a Python dictionary
stock = yf.Ticker("AAPL")
stock
# Let's explore some available methods, add a period "." and then click "tab" to display all available methods
# Note that actions indicate dividends and stock splits
# Recommendations indicate analyst's ratings
# Analysis indicates EPS targets
# Info returns company information in a dictionary format
stock.info
# Let's obtain the company beta
# Remember that Beta is a measure of the security volatility compared to the market (S&P 500)
# Stocks with betas greater than 1.0 are more volatile compared to S&P 500
print("The company beta is = {}".format(stock.info['beta']))
# Let's obtain the company's free cash flow (FCF)
# Free cash flow is the cash left in a company after it pays for its operating and capital expenditures.
print("The company cash is = ${}".format(stock.info['freeCashflow']))
# Let's obtain the Price-to-Earnings (P/E) Ratio
# Price-to-Earnings (P/E) ratio is calculated by dividing the current share price by its earnings per share (EPS)
# High price-to-earnings ratio could indicate that the company's stock is overvalued
# Example: S&P500 P/E ratio ranged from 5x in 1917 to 120x in 2009 right before the financial crisis
# Trailing P/E is calculated using past performance by dividing the current stock price by total EPS earnings over the past 12 months.
print("The company Price-to-Earnings (P/E) ratio is = {} ".format(stock.info['trailingPE']))
# You can also obtain cash flow statements
stock.get_cashflow()
# Let's view some recommendations
stock.recommendations.tail(20)
# Using Yahoo Finance tool to fetch stock data
# Actions is used to obtain dividends and stock splits
dividends_splits_df = stock.actions
dividends_splits_df
# Let's obtain the balance sheet for Apple
balance_df = stock.get_balance_sheet()
balance_df.round()
# Let's import datetime package
import datetime

# Specify the starting date
startDate = datetime.datetime(2021, 3, 1)

# Specify the end date
endDate = datetime.datetime(2022, 3, 1)

# Obtain the stock price data
print(stock.history(start = startDate, end = endDate))


