参考文档
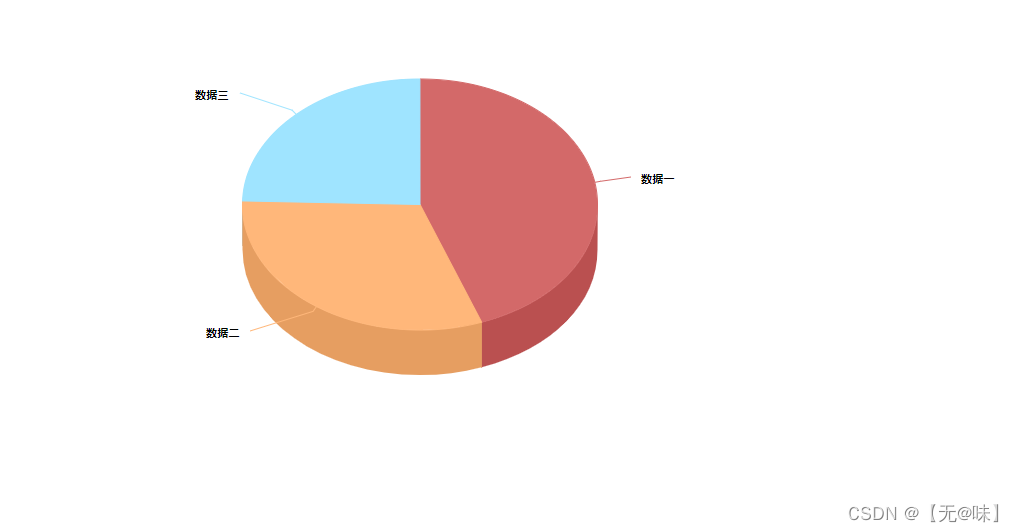
实现效果
实现代码
安装
npm install highcharts --save
npm install highcharts-3d
npm install highcharts-vue
引入
//可以在全局引入。也可在所需要的界面引入
import Highcharts from "highcharts/highcharts";
import highcharts3d from "highcharts/highcharts-3d";
完整代码
<template>
  <div id="EchartsPie" class="EchartsPie"></div>
</template>
<script>
import Highcharts from "highcharts/highcharts";
import highcharts3d from "highcharts/highcharts-3d";
highcharts3d(Highcharts);
export default {
  name: "",

  props: {},

  components: {},

  data() {
    return {
      list: [
        { value: 1048, name: "Search Engine" },
        { value: 735, name: "Direct" },
        { value: 580, name: "Email" },
        { value: 484, name: "Union Ads" },
        { value: 300, name: "Video Ads" },
      ],
    };
  },

  computed: {},

  watch: {},
  created() {},

  methods: {
    queryPie() {
      const data = [];
      this.list.forEach((e) => {
        data.push({
          y: e.value,
          name: e.name,
        });
      });
     Highcharts.chart("EchartsPie", {
        chart: {
          type: "pie",
          options3d: {
            enabled: true,
            alpha: 45, //整体倾斜度
            beta: 0, //向左倾斜为正  向右倾斜为负
          },
        },
        title: {
          text: "",
        },
       tooltip:{
        enabled:false
       },
        marginRight: 120,
        //1、 这时候设置的图例是不显示的
        legend: {
          align: "right", //程度标的目标地位
          verticalAlign: "top", //垂直标的目标地位
          shadow: false,
          layout: "vertical",
          x: -150, // 距离x轴的距离
          y: 0, // 距离Y轴的距离
          symbolPadding: 10,
          symbolHeight: 14,
          symbolRadius:3,
          itemStyle: {
            fontSize: '12px',
          },
        },

        colors: ["#D36969", "#FFB77A", "#9FE4FF", '#FF8282',"rgb(210 186 186)"],

        plotOptions: {
          pie: {
            allowPointSelect:true,
            //用来控制饼图的大小
            size: "100%",
            depth: 25, //3d饼图的高度
             // 2、重点  想要显示图例一定要加上这句话
            showInLegend: true, //重点图例显示
          },
        },
        series: [
          {
            type: "pie",
            name: "",
            data: data,
          },
        ],
      });
    },
  },

  mounted() {
    this.queryPie();
  },
};
</script>

<style scoped>
.containers {
  width: 500px;
  height: 500px;
  margin: 0 auto;
}
.EchartsPie {
  width: 100%;
  height: 100%;
}
/* 禁止跳转到外部接口 */
::v-deep .highcharts-credits {
  display: none;
}
</style>
