1、代码
<div id="mainThree" class="chartBar_box"> </div>

// 柱状图
  const onEchartsThree = () => {
    // 基于准备好的dom,初始化echarts实例
    var myChart = echarts.init(document.getElementById('mainThree'));
    // 指定图表的配置项和数据(进度环图)
    var option = {
      grid: {
        containLabel: true,
        bottom: '10%', // 增加底部边距以确保标签完全显示
      },
      xAxis: {
        type: 'category',
        data: [
          '考试',
          '360卫士',
          '旅行',
          '数学提升',
          '英语提升',
          '语文大讲堂',
          '美术鉴赏',
          '明主生活',
          '我爱科学',
        ],
        axisLabel: {
          rotate: 45, // 将标签旋转45度
        },
      },
      yAxis: {
        type: 'value',
      },
      series: [
        {
          name: '完成进度%', // 为系列添加名称,以便在图例中显示
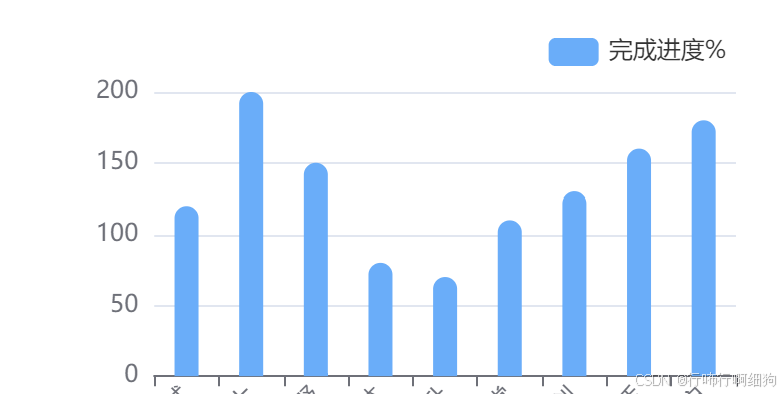
          data: [120, 200, 150, 80, 70, 110, 130, 160, 180],
          type: 'bar',
          barWidth: 12, // 设置柱子的宽度为12px
          itemStyle: {
            color: '#51AFFF', // 改变柱子的颜色为红色
            borderRadius: [10, 10, 0, 0], // 设置柱子的圆角
          },
        },
      ],
      legend: {
        right: '10%', // 将图例放置在右上角
        top: '10%', // 调整图例的垂直位置
      },
    };

    // 使用刚指定的配置项和数据显示图表。
    myChart.setOption(option);
  };
2、效果图
