一丶开始
1.关于Leaflet
Leaflet是用于适用于移动端交互地图的主要的开源JavaScript库。JS库的大小为38k左右,但是拥有大部分开发者需要的全部地图功能。
Leaflet保持着简单、性能和实用性的设计思想。它可以在所有主要的桌面和移动端平台上高效的运转,可以扩展插件,它有一个漂亮的、易用的和文档清晰的API,还有一个简单、易读的源代码。
官网地址:https://leafletjs.com/reference.html
经纬度查询地址:http://jingweidu.757dy.com/
中文API文档:https://www.cnblogs.com/shitao/p/3566598.html
2.开始使用
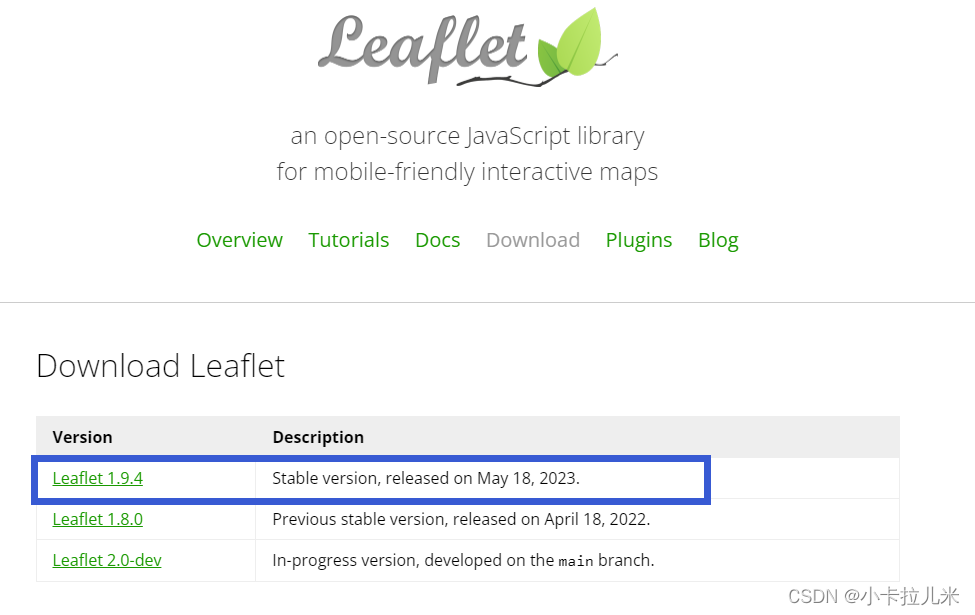
方法1:点击官网的DownLoad按钮,跳转到下载页面,点击对应包下载。
<link rel="stylesheet" href="https://unpkg.com/[email protected]/dist/leaflet.css"/>
<script src="https://unpkg.com/[email protected]/dist/leaflet.js"></script>
方法3:使用npm
npm install leaflet3.建立第一个Map
<!DOCTYPE html>
<html lang="en">
<head>
  <meta charset="UTF-8">
  <meta http-equiv="X-UA-Compatible" content="IE=edge">
  <meta name="viewport" content="width=device-width, initial-scale=1.0">
  <title>Document</title>
  <link rel="stylesheet" href="https://unpkg.com/[email protected]/dist/leaflet.css" />
  <script src="https://unpkg.com/[email protected]/dist/leaflet.js"></script>
</head>
<style>
  * {
    box-sizing: border-box;
    margin: 0px;
    padding: 0px;
  }

  #mapid {
    height: 100vh;
  }
</style>

<body>
  <div id="mapid"></div>
</body>
<script>
  //[31.82658, 117.23344], 13对应纬度、经度、地图的缩放.
  var mymap = L.map('mapid').setView([31.82658, 117.23344], 13);
  L.tileLayer('http://{s}.tile.openstreetmap.org/{z}/{x}/{y}.png', {
    maxZoom: 18//最大缩放
  }).addTo(mymap);
</script>
</html>
在Vue中使用
先 npm install leaflet到项目中
<template>
<div id="container"></div>
</template>
<script >
//引入leaflet
import * as L from 'leaflet'
import 'leaflet/dist/leaflet.css'
//或者可以在main.js中把leaflet挂载到全局
// app.config.globalProperties.L= L
//map地图实例
const map=ref(null)
function initMap() {
map.value = L.map(container, { editable: true }).setView(
[30.66, 104.07],
layerLevel
)
L.tileLayer(sourceUrl, {
// L.tileLayer(
// 'http://192.168.0.250/WeServer/wmts/1.0.0/layer/default/wgs84/{z}/{y}/{x}.png',
// {
maxZoom: 18,
attribution:
'Map data © <a href="https://www.openstreetmap.org/">OpenStreetMap</a> contributors, <a href="https://creativecommons.org/licenses/by-sa/2.0/">CC-BY-SA</a>',
id: 'base',
}).addTo(unref(map))
L.control.scale().addTo(unref(map))
// 获取 attribution 控件对象
const attributionControl = unref(map).attributionControl
// 移除默认的 attribution 控件内容
attributionControl.setPrefix('')
// 添加自定义的 attribution 控件内容
// attributionControl.addAttribution(``)
}
//在Onmounted中调用initMap方法即可建立地图
</script>1.添加图形或标注点
在leaflet中标注点用得比较多。
marker标注点
//调用L.marker传入标注点的经纬度,再调用addTo添加到地图中
//L.marker(<LatLng> latlng, <Marker options>
L.marker([50.5, 30.5]).addTo(map);
//在第二个参数中可以传一个对象来定义标注点的各种信息,例如icon:{},title等
// 生成自定义icon
/*
这个我根据源代码中查找到的icon的一些属性,配置这些属性值icon才会在标注点的中央上,否则不配置的话会有偏移。
*/
function createCustomIcon(url) {
  return L.icon({
    iconUrl: url,
    iconSize: [25, 41],
    iconAnchor: [12, 41],
    popupAnchor: [1, -34],
    tooltipAnchor: [16, -28],
  })
}
popup弹窗
//通过以下方法生成弹窗信息
var popup = L.popup()
    .setLatLng(latlng)
    .setContent('<p>Hello world!<br />This is a nice popup.</p>')
    .openOn(map);
//或者可以这样
var popup = L.popup(latlng, {content: '<p>Hello world!<br />This is a nice popup.</p>'})
    .openOn(map);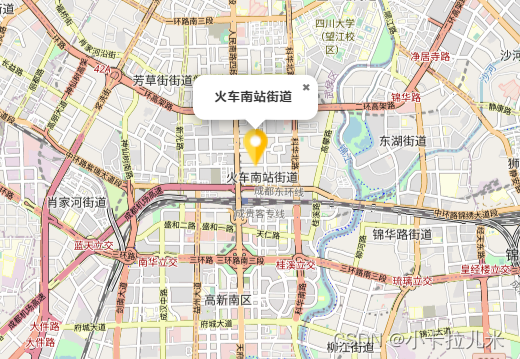
标注点添加弹窗
const marker = L.marker([31.82685,117.23344]).addTo(map)
marker.bindPopup("标注点").openPopup
Tooltip提示

const marker = L.marker([31.82658,117.23344]).addTo(map)
marker.bindTooltip("my tooltip text").openTooltip()
圆形
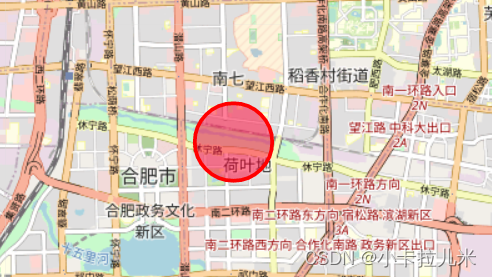
 var circle = L.circle([31.82658, 117.23344], {
    color: 'red',
    fillColor: '#f03',
    fillOpacity: 0.5,
    radius: 500
  }).addTo(map);
多边形

var polygon = L.polygon([
    [31.82127,117.21837],
    [31.82317,117.27629],
    [31.85082,117.25333]
])
矩形范围
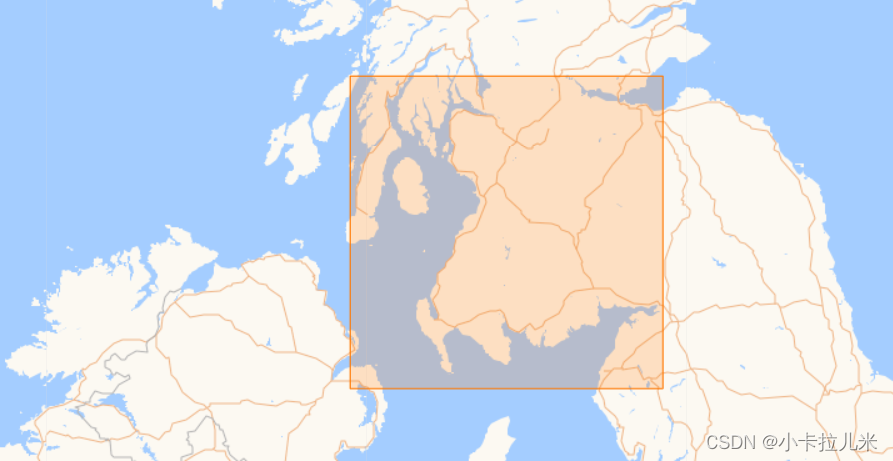
// define rectangle geographical bounds
var bounds = [[54.559322, -5.767822], [56.1210604, -3.021240]];
// create an orange rectangle
L.rectangle(bounds, {color: "#ff7800", weight: 1}).addTo(map);
// zoom the map to the rectangle bounds
map.fitBounds(bounds);详细配置参考官网文档:Documentation - Leaflet - a JavaScript library for interactive maps
圆形范围

L.circle([31.85082,117.25333],{radius:1000}).addTo(map);详细配置参考官网文档:Documentation - Leaflet - a JavaScript library for interactive maps
加载图片
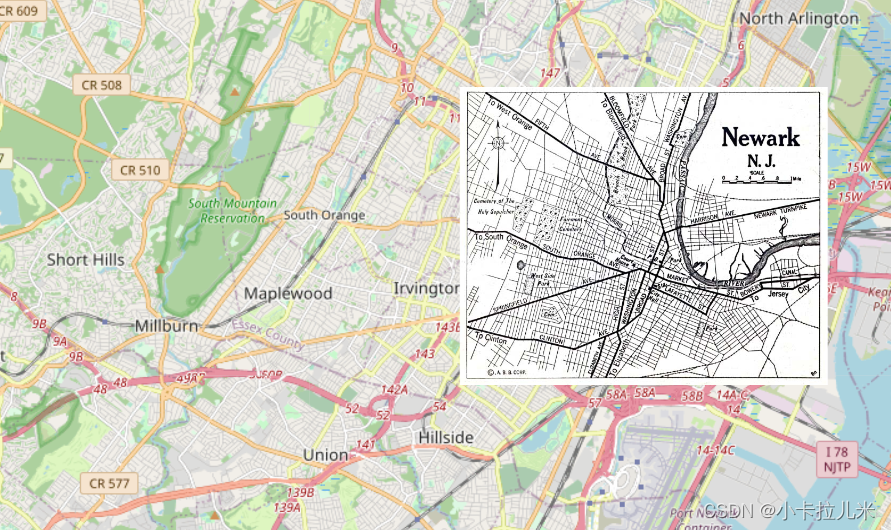
var imageUrl = 'https://maps.lib.utexas.edu/maps/historical/newark_nj_1922.jpg',
    imageBounds = [[40.712216, -74.22655], [40.773941, -74.12544]];
L.imageOverlay(imageUrl, imageBounds).addTo(map);
加载视频影像
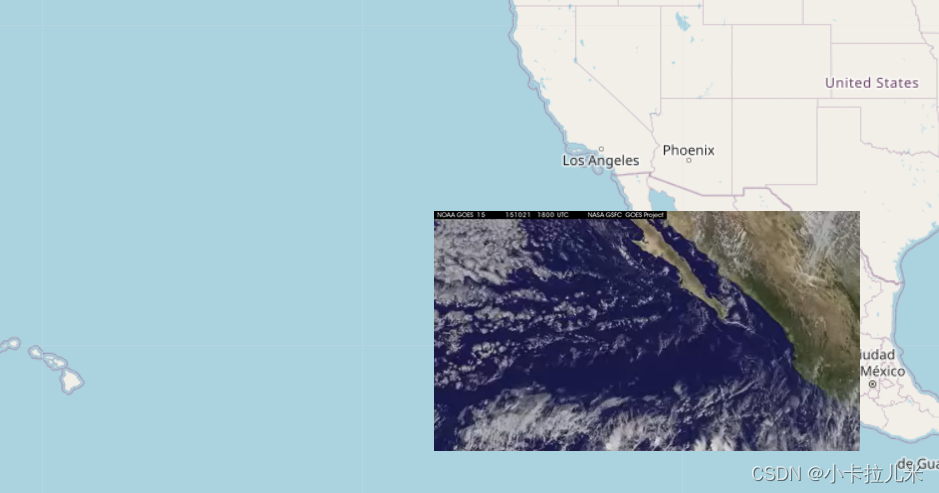
 var videoUrl = 'https://www.mapbox.com/bites/00188/patricia_nasa.webm',
    videoBounds = [[32, -130], [13, -100]];
L.videoOverlay(videoUrl, videoBounds).addTo(map);
2. 加载多个地图类型
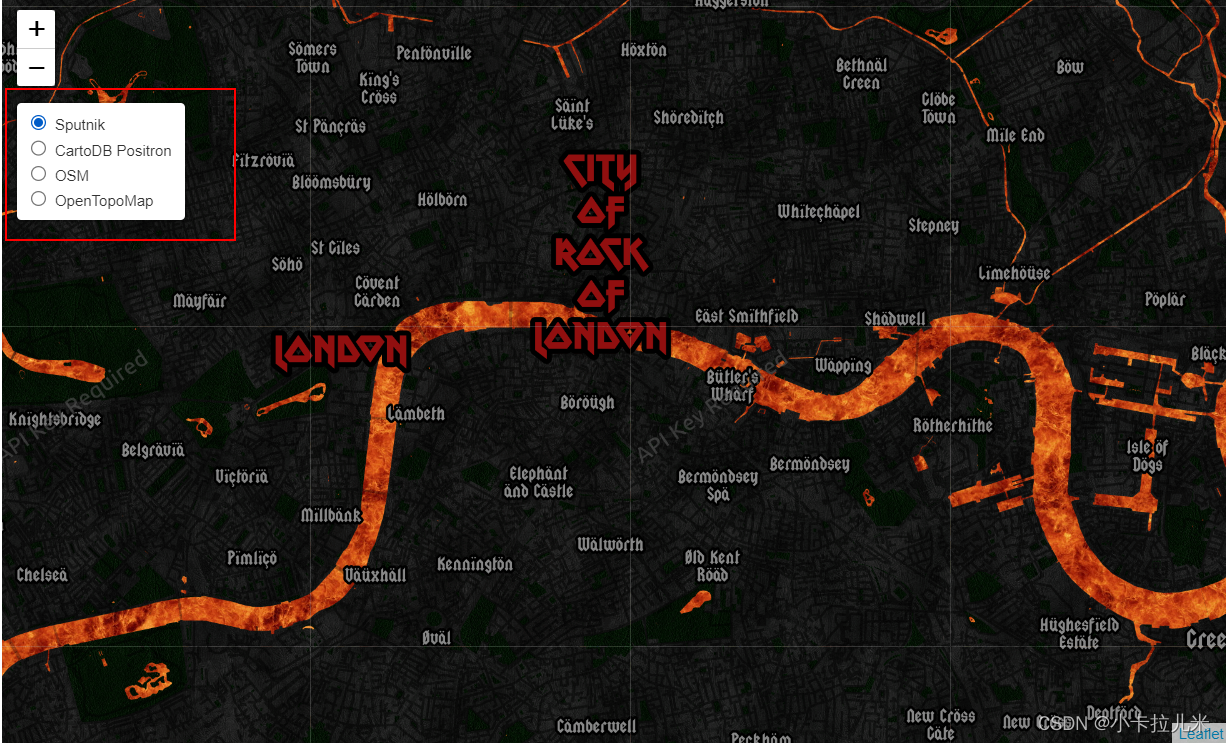
 var baseLayers = {
    'Sputnik': L.tileLayer('https://{s}.tile.thunderforest.com/spinal-map/{z}/{x}/{y}{r}.png', {
      maxZoom: 18
    }),

    "CartoDB Positron": L.tileLayer('http://{s}.basemaps.cartocdn.com/light_all/{z}/{x}/{y}.png', {
      maxZoom: 18
    }),

    "OSM": L.tileLayer('http://{s}.tile.openstreetmap.org/{z}/{x}/{y}.png', {
      maxZoom: 18
    }).addTo(map),

    "OpenTopoMap": L.tileLayer('https://{s}.tile.opentopomap.org/{z}/{x}/{y}.png', {
      maxZoom: 18
    }),
  }
  //切换图层工具
  var layerControl = L.control.layers(baseLayers, {}, {
    position: 'topleft',
    collapsed: true
}).addTo(map);更多地图类型(http://{s}.tile.openstreetmap.org/{z}/{x}/{y}.png)可以查看OpenWhateverMap :: An Open Awsumnez Map
3.leaflet插件
(1)leaflet-measure
(2)Leaflet Routing Machine基于Leaflet的路径引擎
官方文档:https://www.liedman.net/leaflet-routing-machine/
Leaflet Routing Machine(以下简称LRM)试图给复杂的问题提供一个简单的解决方案:现实中,路径可以是多方面的,并且用于各种场景的用户界面也大不相同; 大多数站点都希望用自己的样式实现用户界面。LRM 通过默认值来解决这一问题:只需要几行代码就可以添加基本的路径功能。另外,在用户界面、功能、样式等方面,LRM 有很强的可扩展性,都是可定制的。
使用
在Leaflet页面引用leaflet-routing-machine.css 和 leaflet-routing-machine.js 即可。
    <link rel="stylesheet" type="text/css" href="leaflet.css">
    <link rel="stylesheet" type="text/css" href="leaflet-routing-machine.css">
     <script src="leaflet.js"></script>
     <script src="leaflet-routing-machine.js"></script>
或者还可以通过NPM进行安装。
npm install --save leaflet-routing-machine使用以下几行代码就可以添加基本的路径控制,其中control是用路径控制类,其属性waypoints表示经过的路点。
L.Routing.control({
        serviceUrl: 'http://192.168.0.132:8082/map/route/v1',
        // serviceUrl: 'https://api.mapbox.com/directions/v5',
        //语言设置,起初是没有中文的,需要再源代码当中更改。
        language: 'zh-Hans',
        waypoints: [
          unref(routeMarkers)[0]._latlng,
          unref(routeMarkers)[1]._latlng,
        ],
        showAlternatives: true,
        //主线路的样式设置
        lineOptions: {
          styles: [
            { color: '#fff', opacity: 1, weight: 8 },
            { color: '#1565c0', opacity: 0.9, weight: 7 },
            // { color: 'blue', opacity: 1, weight: 2 },
          ],
        },
        //备用线路的样式设置
        altLineOptions: {
          styles: [
            { color: '#b71c1c', opacity: 1, weight: 8 },
            { color: '#e53935', opacity: 0.5, weight: 6 },
            { color: '#ffcdd2', opacity: 1, weight: 1, dashArray: '10, 5' },
          ],
        },
        //起点和终点的icon设置
        createMarker: function (i, start, n) {
          return null
          //for (i = 0; waypoint.length; i++){
        },
      })
也可以在初始化control之后,用函数setWaypoints进行设定。
//设置路点,注意路点的格式为纬度在前,经度在后
control.setWaypoints([
    L.latLng( 28.142105,112.9547356),
    L.latLng( 28.2290135,112.923814)
]);
选择路径的事件routeselected,在选择到某条线路的时候触发。
routingControl.on('routeselected', function (e) {
        var route = e.route
        // 在这里处理所选路线的相关信息
        console.log(route)
})
(3)leaflet-contextmenu
显示效果
插件地址
GitHub - aratcliffe/Leaflet.contextmenu: A context menu for Leaflet.
<link rel="stylesheet" href="./css/contextmenu.css" />
<script src="./js/leaflet.contextmenu.js"></script>
或者通过npm的方式下载
import 'leaflet-contextmenu/dist/leaflet.contextmenu.js'
import 'leaflet-contextmenu/dist/leaflet.contextmenu.css'
var map = L.map('map', {
contextmenu: true,
contextmenuWidth: 140,
//不触发一直点击菜单一直出现
contextmenuInheritItems: false,
contextmenuItems: [{
text: '显示坐标',
callback: showCoordinates
}, {
text: '作为地图中心',
callback: centerMap
}, '-', {
text: '地图放大',
icon: './icon/zoom-in.png',
callback: zoomIn
}, {
text: '地图缩小',
icon: './icon/zoom-out.png',
callback: zoomOut
}]
}).setView([36.09, 120.35], 13);
L.tileLayer('https://{s}.tile.openstreetmap.org/{z}/{x}/{y}.png', {
attribution: ''
}).addTo(map);
function showCoordinates(e) {
alert(e.latlng);
}
function centerMap(e) {
map.panTo(e.latlng);
}
function zoomIn(e) {
map.zoomIn();
}
function zoomOut(e) {
map.zoomOut();
}