该案例来自吴恩达深度学习系列课程一《神经网络和深度学习》第二周编程作业,设计具有神经网络思维的逻辑回归,作业内容是搭建一个能够识别猫的简单的神经网络。作业提供的资料包括:训练集(train_catvnoncat.h5)和测试集(test_catvnoncat.h5)和加载数据的工具包(lr_utils.py),下载请移步参考链接一。
文章目录
1 介绍
1.1 案例应用核心公式
向量化逻辑回归梯度下降计算
Z = w T X + b = n p . d o t ( w . T , X ) + b Z = w^{T}X + b = np.dot( w.T,X)+b Z=wTX+b=np.dot(w.T,X)+b
A = σ ( Z ) A = \sigma( Z ) A=σ(Z)
d Z = A − Y dZ = A - Y dZ=A−Y
d w = 1 m ∗ X ∗ d Z T {{dw} = \frac{1}{m}*X*dZ^{T}\ } dw=m1∗X∗dZT
d b = 1 m ∗ n p . s u m ( d Z ) db= \frac{1}{m}*np.sum( dZ) db=m1∗np.sum(dZ)
w : = w − α ∗ d w w: = w - \alpha*dw w:=w−α∗dw
b : = b − α ∗ d b b: = b - \alpha*db b:=b−α∗db
1.2 设计库和主要接口
numpy库:用于进行科学计算。
numpy.array:创建一个数组。
numpy.squeeze:从a中删除长度为1的轴。
numpy.reshape:为数组提供新形状而不更改数据。
numpy.exp:计算输入数组中所有元素的指数。
numpy.zeros:返回一个给定形状和类型的新数组,填充零。
numpy.sum:给定轴上数组元素的总和。
numpy.dot:两个阵列的点积。
numpy.mean:计算沿指定轴的算术平均值,默认取平坦阵列的平均值。
matplotlib库:用于绘制图表。
matplotlib.pyplot.imshow:将数据显示为图像。
matplotlib.pyplot.show:显示所有打开的图形。
matplotlib.pyplot.plot:将y与x绘制为线条和/或标记。
matplotlib.pyplot.legend:在图上显示图例。
h5py库:与h5文件中存储的数据集进行交互。
2 编码
2.1 加载数据的工具包
lr_utils.py
import h5py
import numpy as np


def load_dataset():
    train_dataset = h5py.File('datasets/train_catvnoncat.h5', "r")
    train_set_x_orig = np.array(train_dataset["train_set_x"][:])  # your train set features
    train_set_y_orig = np.array(train_dataset["train_set_y"][:])  # your train set labels

    test_dataset = h5py.File('datasets/test_catvnoncat.h5', "r")
    test_set_x_orig = np.array(test_dataset["test_set_x"][:])  # your test set features
    test_set_y_orig = np.array(test_dataset["test_set_y"][:])  # your test set labels

    classes = np.array(test_dataset["list_classes"][:])  # the list of classes

    train_set_y_orig = train_set_y_orig.reshape((1, train_set_y_orig.shape[0]))
    test_set_y_orig = test_set_y_orig.reshape((1, test_set_y_orig.shape[0]))

    return train_set_x_orig, train_set_y_orig, test_set_x_orig, test_set_y_orig, classes
2.2 查看数据集相关参数
check_data.py
import numpy as np
import matplotlib.pyplot as plt
from lr_utils import load_dataset

train_set_x_orig, train_set_y, test_set_x_orig, test_set_y, classes = load_dataset()


# 查看训练集图片
def see_train_image(index):
    plt.imshow(train_set_x_orig[index])
    print("y=" + str(train_set_y[:, index]) + ", it's a " + classes[np.squeeze(train_set_y[:, index])].decode(
        "utf-8") + "'s picture")
    plt.show()


# 计算和打印相关数据参数
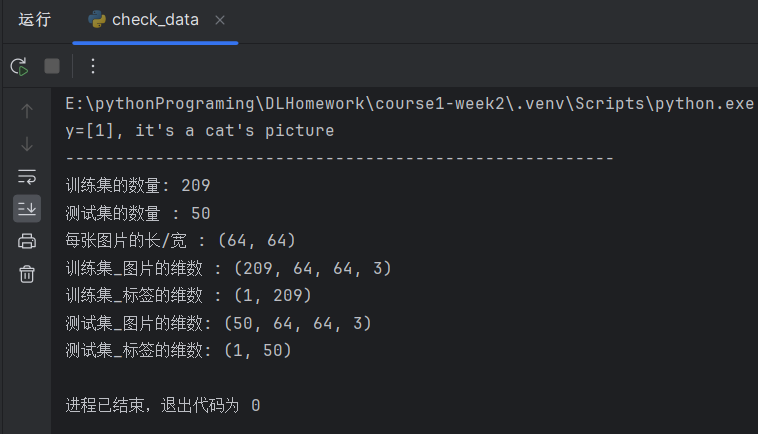
def print_data():
    print("训练集的数量: " + str(train_set_y.shape[1]))
    print("测试集的数量 : " + str(test_set_y.shape[1]))
    print("每张图片的长/宽 : " + str(train_set_x_orig.shape[1:3]))
    print("训练集_图片的维数 : " + str(train_set_x_orig.shape))
    print("训练集_标签的维数 : " + str(train_set_y.shape))
    print("测试集_图片的维数: " + str(test_set_x_orig.shape))
    print("测试集_标签的维数: " + str(test_set_y.shape))


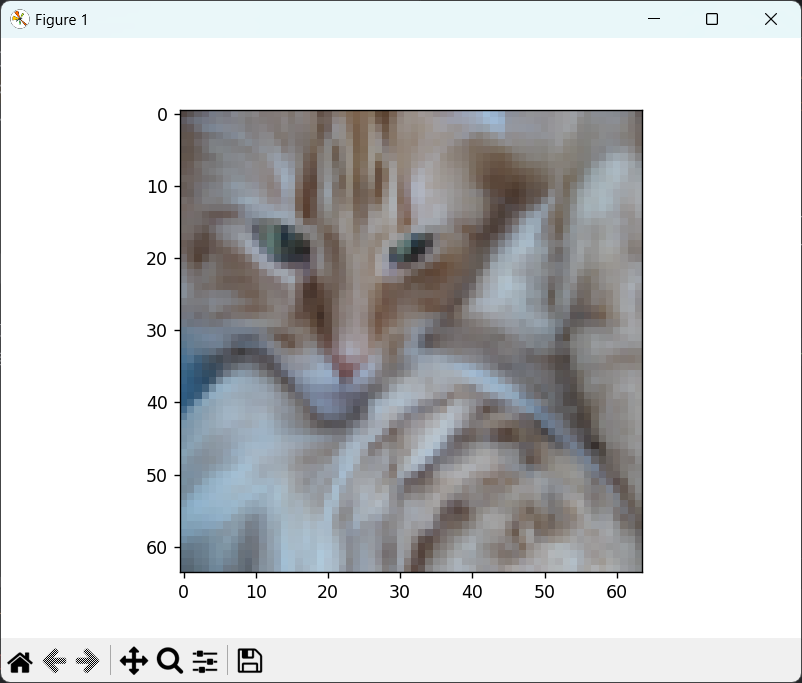
see_train_image(2)
print("-------------------------------------------------------")
print_data()
2.3 逻辑回归模型的构建
cat_nn.py
import numpy as np  # Python进行科学计算
from lr_utils import load_dataset  # 加载资料包里的数据

# 加载训练集和测试集的数据
train_set_x_orig, train_set_y, test_set_x_orig, test_set_y, classes = load_dataset()

# 图片参数降维处理
train_set_x_flatten = train_set_x_orig.reshape(train_set_x_orig.shape[0], -1).T
test_set_x_flatten = test_set_x_orig.reshape(test_set_x_orig.shape[0], -1).T

# 图片像素值标准化使其位于区间[0,1]
train_set_x = train_set_x_flatten / 255
test_set_x = test_set_x_flatten / 255


# 创建sigmoid函数
def sigmoid(z):
    s = 1 / (1 + np.exp(-z))
    return s


# 初始化w和b为列向量
def initialize_with_zeros(dim):
    w = np.zeros((dim, 1))
    b = 0
    return w, b


# 实现前向和后向传播计算
def propagate(w, b, X, Y):
    m = X.shape[1]
    A = sigmoid(np.dot(w.T, X) + b)
    cost = (-1 / m) * np.sum(Y * np.log(A) + (1 - Y) * np.log(1 - A))
    dZ = A - Y
    dw = (1 / m) * np.dot(X, dZ.T)
    db = (1 / m) * np.sum(dZ)
    grads = {
        "dw": dw,
        "db": db
    }
    return grads, cost


# 使用多次梯度下降更新参数
def optimize(w, b, X, Y, num_iterations, learning_rate, print_cost=False):
    dw = np.zeros(X.shape[0])
    db = 0
    costs = []
    for i in range(num_iterations):
        grads, cost = propagate(w, b, X, Y)
        dw = grads["dw"]
        db = grads["db"]
        w = w - learning_rate * dw
        b = b - learning_rate * db
        if i % 100 == 0:
            costs.append(cost)
        if print_cost and (i % 100 == 0):
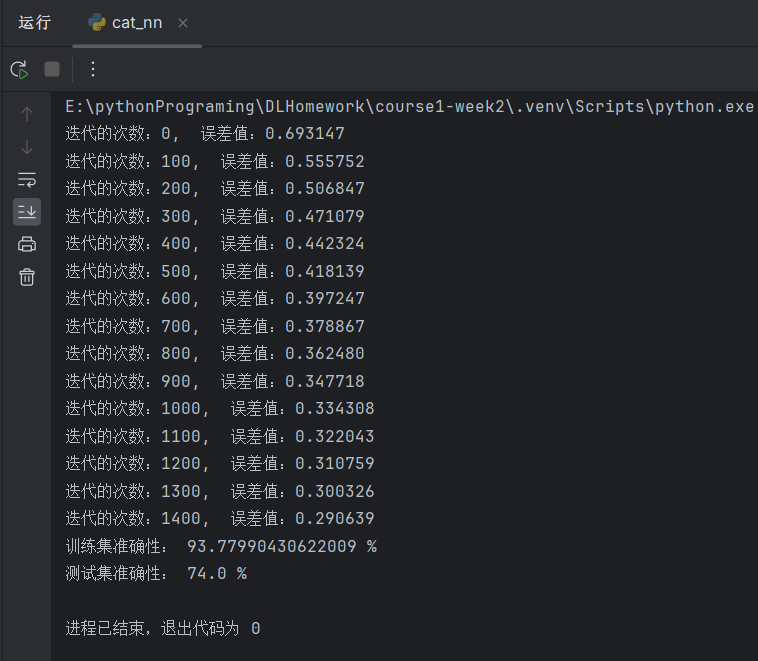
            print("迭代的次数:%i,  误差值:%f" % (i, cost))
    params = {
        "w": w,
        "b": b
    }
    grads = {
        "dw": dw,
        "db": db
    }
    return params, grads, costs


# 实现预测函数
def predict(w, b, X):
    m = X.shape[1]
    Y_prediction = np.zeros((1, m))
    w = w.reshape(X.shape[0], 1)
    A = sigmoid(np.dot(w.T, X) + b)
    for i in range(A.shape[1]):
        Y_prediction[0, i] = 1 if A[0, i] > 0.5 else 0
    return Y_prediction


# 构建逻辑回归模型
def model(X_train, Y_train, X_test, Y_test, num_iterations=2000, learning_rate=0.5, print_cost=False):
    w, b = initialize_with_zeros(X_train.shape[0])
    params, grads, costs = optimize(w, b, X_train, Y_train, num_iterations, learning_rate, print_cost)
    w, b = params['w'], params['b']
    Y_prediction_train = predict(w, b, X_train)
    Y_prediction_test = predict(w, b, X_test)
    print("训练集准确性:", format(100 - np.mean(np.abs(Y_prediction_train - Y_train)) * 100), "%")
    print("测试集准确性:", format(100 - np.mean(np.abs(Y_prediction_test - Y_test)) * 100), "%")
    d = {
        "costs": costs,
        "Y_prediction_test": Y_prediction_test,
        "Y_prediction_train": Y_prediction_train,
        "w": w,
        "b": b,
        "learning_rate": learning_rate,
        "num_iterations": num_iterations
    }
    return d


# 正式运行猫图识别的神经网络
if __name__ == '__main__':
    model(train_set_x, train_set_y, test_set_x, test_set_y, num_iterations=2000, learning_rate=0.002, print_cost=True)
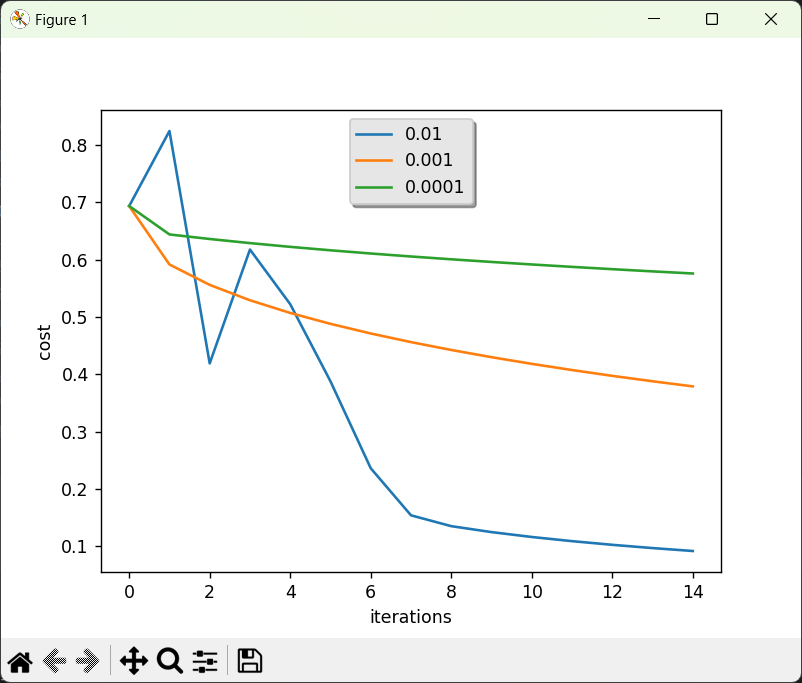
2.4 不同学习率的比较
compare_learn.py
import matplotlib.pyplot as plt
from cat_nn import *

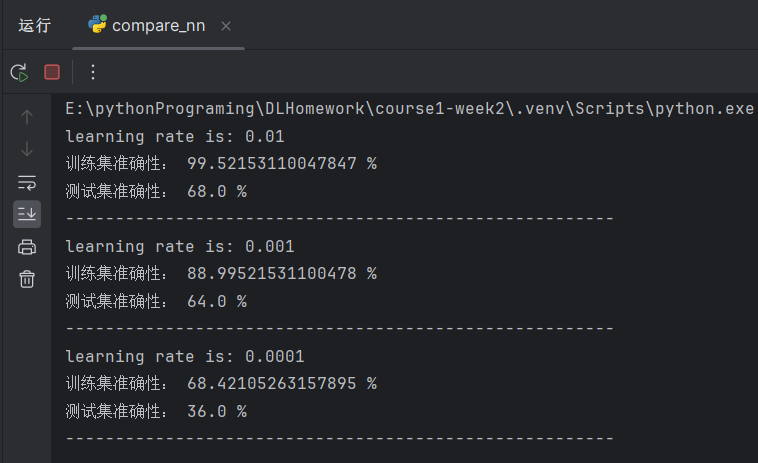
learning_rates = [0.01, 0.001, 0.0001]
models = {}
for i in learning_rates:
    print("learning rate is: " + str(i))
    models[str(i)] = model(train_set_x, train_set_y, test_set_x, test_set_y, num_iterations=1500, learning_rate=i, print_cost=False)
    print("-------------------------------------------------------")

for i in learning_rates:
    plt.plot(np.squeeze(models[str(i)]["costs"]), label=str(models[str(i)]["learning_rate"]))

plt.ylabel('cost')
plt.xlabel('iterations')
legend = plt.legend(loc='upper center', shadow=True)
frame = legend.get_frame()
frame.set_facecolor('0.90')
plt.show()
3 调试
3.1 将图像数据降维处理
print("---------origin-----------")
print(train_set_x_orig)

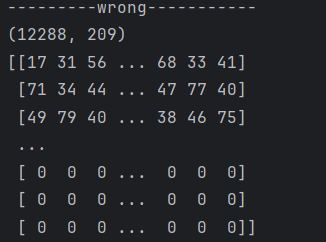
print("---------wrong-----------")
train_set_x_flatten = train_set_x_orig.reshape(-1, train_set_x_orig.shape[0])
test_set_x_flatten = test_set_x_orig.reshape(-1, test_set_x_orig.shape[0])
print(train_set_x_flatten.shape)
print(train_set_x_flatten)

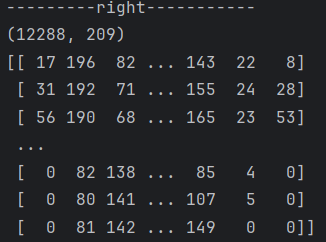
print("---------right-----------")
train_set_x_flatten = train_set_x_orig.reshape(train_set_x_orig.shape[0], -1).T
test_set_x_flatten = test_set_x_orig.reshape(test_set_x_orig.shape[0], -1).T
print(train_set_x_flatten.shape)
print(train_set_x_flatten)
问题在于“-1”的使用,参考文档原文指出“One shape dimension can be -1. In this case, the value is inferred from the length of the array and remaining dimensions.”。经过测试和观察,使用reshape重塑形状,矩阵会先确定已知的维度,之后按顺序(从左到右,从上到下)分配剩余的元素,所以采取先按行分布再转置的方式才能得到正确的数据。
 |  |
|---|
4 参考
【中文】【吴恩达课后编程作业】Course 1 - 神经网络和深度学习 - 第二周作业_吴恩达机器学习课后作业目录对应视频-CSDN博客
