此文章首发于公众号:Python for Finance
链接:https://mp.weixin.qq.com/s/CJR2gwXkkzFRavZ8I98qdw
布林带(BOLL)指标是美国股市分析家约翰·布林根据统计学中的标准差原理设计出来的一种非常简单实用的技术分析指标。一般而言,股价的运动总是围绕某一价值中枢(如均线、成本线等)在一定的范围内变动,布林线指标正是在上述条件的基础上,引进了“股价通道”的概念,其认为股价通道的宽窄随着股价波动幅度的大小而变化,而且股价通道又具有变异性,它会随着股价的变化而自动调整。
一、计算布林带
首先我们导入相关库。
import pandas as pd
import numpy as np
from matplotlib import pyplot as plt
接下来编写一个函数来计算我们的布林带。
- 中轨:股价的平均成本,N时间段的简单移动平均
- 上轨:压力线,上轨 = 中轨 + K × N时间段的标准差
- 下轨:支撑线,下轨 = 中轨 − K × N时间段的标准差
def calculate_bollinger_bands(df, window = 20, no_of_std = 2, column_name = ''):
    '''
    Parameters
    ----------
    df : 股价数据集
    window : 计算的周期,默认20天
    no_of_std : 标准偏差的倍数,默认2
    column_name : 股价数据集选择的列名,默认为第一列
    '''
    if column_name == '':
        column_name = df.columns[0]
    df['Observation']=df[column_name]
    df['RollingMean'] = df[column_name].rolling(window).mean()
    std = df[column_name].rolling(window).std(ddof=0)
    df['UpperBound'] = df['RollingMean'] + no_of_std * std
    df['LowerBound'] = df['RollingMean'] - no_of_std * std
    bb = df[['Observation','RollingMean','UpperBound','LowerBound']]
    bb.plot(title='Observation with Bollinger Bands') #绘制布林带
    return df
我们以SPY数据为例,csv文件地址如下:链接:https://pan.baidu.com/s/1uqX_F07q28SaYMtosque3w ,提取码:vwi2。
我们读取SPY价格数据。
df = pd.read_csv(r'C:\Users\mi\Desktop\SPY.csv')
df = df.set_index('Date')
数据如下:
>>>df
                  Open        High  ...   Adj Close    Volume
Date                                ...
2021-08-10  442.609985  443.440002  ...  436.474243  43339300
2021-08-11  443.820007  443.880005  ...  437.558807  44034300
2021-08-12  443.619995  445.260010  ...  438.870117  38909400
2021-08-13  445.589996  445.940002  ...  439.668823  39470300
2021-08-16  444.529999  447.109985  ...  440.704102  73740000
               ...         ...  ...         ...       ...
2022-08-04  414.369995  415.089996  ...  414.170013  45656600
2022-08-05  409.660004  414.149994  ...  413.470001  56755600
2022-08-08  415.250000  417.619995  ...  412.989990  53886100
2022-08-09  412.220001  412.750000  ...  411.350006  44840500
2022-08-10  418.779999  420.040009  ...  419.276886  30838744

[253 rows x 6 columns]
我们以SPY数据为例,计算其布林带。
df = calculate_bollinger_bands(df, 10, 2, 'Adj Close') #计算布林带
数据如下:
>>>df
                  Open        High  ...  UpperBound  LowerBound
Date                                ...
2021-08-10  442.609985  443.440002  ...         NaN         NaN
2021-08-11  443.820007  443.880005  ...         NaN         NaN
2021-08-12  443.619995  445.260010  ...         NaN         NaN
2021-08-13  445.589996  445.940002  ...         NaN         NaN
2021-08-16  444.529999  447.109985  ...         NaN         NaN
               ...         ...  ...         ...         ...
2022-08-04  414.369995  415.089996  ...  421.151341  388.468666
2022-08-05  409.660004  414.149994  ...  422.323881  390.972127
2022-08-08  415.250000  417.619995  ...  422.553138  394.226867
2022-08-09  412.220001  412.750000  ...  418.489248  402.382755
2022-08-10  418.779999  420.040009  ...  419.151863  405.367516

[253 rows x 10 columns]
绘制的布林带图形如下:
三、构建策略,计算持仓头寸序列和买卖信号序列
策略的关键是得到持仓头寸序列和买卖信号序列。
布林带策略有多种。
(1)均值回归策略
布林线均值回归策略认为,标的价格在上轨线和下轨线围成的范围内浮动,即使短期内突破上下轨,但长期内仍然会回归到布林带之中。因此,一旦突破上下轨,即形成买卖信号。
我们可构建策略1:
当股价由下向上穿过上轨的时候,做空;然后由上向下穿过中轨的时候,平仓。
当股价由上向下穿过下轨的时候,做多;然后由下向上穿过中轨的时候,平仓。
def calculate_strategy1_position(df):
    '''
    策略1:均值回归策略
    当收盘价由下向上穿过上轨的时候,做空;然后由上向下穿过中轨的时候,平仓。
    当收盘价由上向下穿过下轨的时候,做多;然后由下向上穿过中轨的时候,平仓。
    '''
    xs = (df.Observation - df.RollingMean) / (df.Observation.shift(1) - df.RollingMean.shift(1))
    df['position'] = np.nan
    df['position'] = np.where(df.Observation<df.LowerBound, 1,df['position'])
    df['position'] = np.where(df.Observation>df.UpperBound ,-1,df['position'])
    df['position'] = np.where(xs<0, 0, df['position'])
    df['position'] = df['position'].ffill().fillna(0)
    #买入开仓
    long_entry_condition = (df['position']==1) & (df['position'].shift(1)!=1)
    df.loc[long_entry_condition,'signal_long'] = 1
    #卖出平仓
    long_exit_condition = (df['position']!=1) &(df['position'].shift(1)==1)
    df.loc[long_exit_condition,'signal_long'] = 0
    #卖出开仓
    short_entry_condition = (df['position']==-1) & (df['position'].shift(1)!=-1)
    df.loc[short_entry_condition,'signal_short'] = -1
    #买入平仓
    short_exit_condition = (df['position']!=-1) & (df['position'].shift(1)==-1)
    df.loc[short_exit_condition,'signal_short'] = 0
    return df
(2)趋势性交易策略
布林线趋势性交易策略略认为,标的价格在上轨线和下轨线围成的范围内浮动,如果突破上轨,通常认为产生上涨趋势,做多;如果突破下轨,通常认为产生下跌趋势,做空。因此,一旦突破上下轨,即形成买卖信号。
我们可构建策略2:
当股价由下向上穿过上轨的时候,做多;然后由上向下穿过上轨的时候,平仓。
当股价由上向下穿过下轨的时候,做空;然后由下向上穿过下轨的时候,平仓。
策略3:
当股价由下向上穿过上轨的时候,做多;然后由上向下穿过中轨的时候,平仓。
当股价由上向下穿过下轨的时候,做空;然后由下向上穿过中轨的时候,平仓。
def calculate_strategy2_position(df):
    '''
    -------
    策略2:
    当收盘价由下向上穿过上轨的时候,做多;然后由上向下穿过上轨的时候,平仓。
    当收盘价由上向下穿过下轨的时候,做空;然后由下向上穿过下轨的时候,平仓。
    '''
    #position : 持仓头寸,多仓为1,不持仓为0,空仓为-1
    #siganal : 交易信号,做多为1,平仓为0,做空为-1
    df['position'] = np.where(df.Observation > df.UpperBound, 1, 0)
    df['position'] = np.where(df.Observation < df.LowerBound, -1, df['position'])
    #买入开仓
    long_entry_condition = (df['position']==1) & (df['position'].shift(1)!=1)
    df.loc[long_entry_condition,'signal_long'] = 1
    #卖出平仓
    long_exit_condition = (df['position']!=1) &(df['position'].shift(1)==1)
    df.loc[long_exit_condition,'signal_long'] = 0
    #卖出开仓
    short_entry_condition = (df['position']==-1) & (df['position'].shift(1)!=-1)
    df.loc[short_entry_condition,'signal_short'] = -1
    #买入平仓
    short_exit_condition = (df['position']!=-1) & (df['position'].shift(1)==-1)
    df.loc[short_exit_condition,'signal_short'] = 0
    return df

def calculate_strategy3_position(df):
    '''
    策略3:
    当收盘价由下向上穿过上轨的时候,做多;然后由上向下穿过中轨的时候,平仓。
    当收盘价由上向下穿过下轨的时候,做空;然后由下向上穿过中轨的时候,平仓。
    '''
    xs = (df.Observation - df.RollingMean) / (df.Observation.shift(1) - df.RollingMean.shift(1))
    df['position'] = np.nan
    df['position'] = np.where(df.Observation>df.UpperBound, 1,df['position']) #做多
    df['position'] = np.where(df.Observation<df.LowerBound ,-1,df['position']) #做空
    df['position'] = np.where(xs<0, 0, df['position']) #平仓
    df['position'] = df['position'].ffill().fillna(0)
    #买入开仓
    long_entry_condition = (df['position']==1) & (df['position'].shift(1)!=1)
    df.loc[long_entry_condition,'signal_long'] = 1
    #卖出平仓
    long_exit_condition = (df['position']!=1) &(df['position'].shift(1)==1)
    df.loc[long_exit_condition,'signal_long'] = 0
    #卖出开仓
    short_entry_condition = (df['position']==-1) & (df['position'].shift(1)!=-1)
    df.loc[short_entry_condition,'signal_short'] = -1
    #买入平仓
    short_exit_condition = (df['position']!=-1) & (df['position'].shift(1)==-1)
    df.loc[short_exit_condition,'signal_short'] = 0
    return df
四、计算策略收益
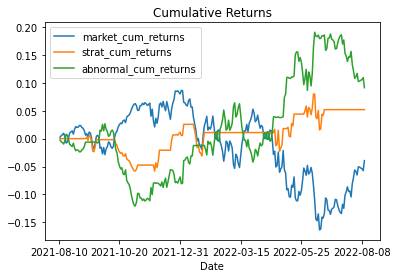
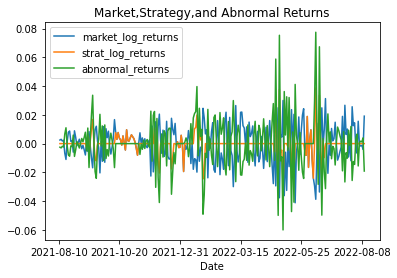
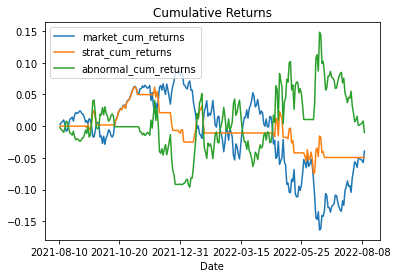
我们可编制函数,计算市场收益率、策略收益率及策略超常收益率。注意我们的买卖信号出现后,第二天才能进行交易。
def calculate_returns(df):
    # 计算市场对数收益率、策略对数收益率、策略超常收益率
    df['market_log_returns'] = np.log(df['Observation']/df['Observation'].shift(1))
    df['strat_log_returns'] = df['position'].shift(1)* df['market_log_returns'] #交易信号出现后第二天交易
    df['abnormal_returns'] = df['strat_log_returns'] - df['market_log_returns']
    # 计算市场累积收益率、策略累积收益率、策略累积超常收益率
    df['market_cum_returns'] = np.exp(df['market_log_returns'].cumsum()) - 1
    df['strat_cum_returns'] = np.exp(df['strat_log_returns'].cumsum()) - 1
    df['abnormal_cum_returns'] = df['strat_cum_returns'] - df['market_cum_returns']
    # 绘图
    ret = df[['market_log_returns','strat_log_returns','abnormal_returns']]
    ret.plot(title='Market,Strategy,and Abnormal Returns')
    cum_returns = df[['market_cum_returns','strat_cum_returns','abnormal_cum_returns']]
    cum_returns.plot(title='Cumulative Returns')
    return df
五、绘制交易信号
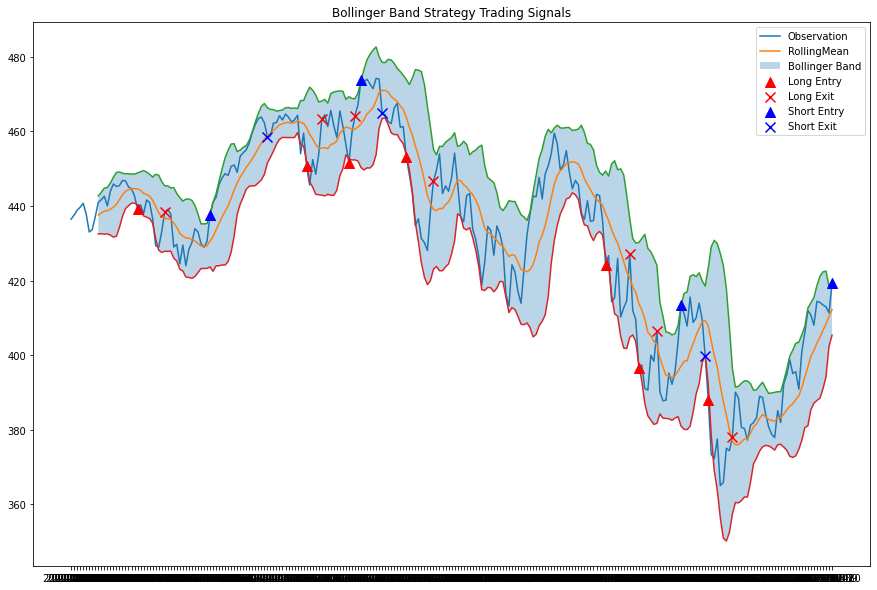
我们可编制函数,将买卖信号标注在布林带中。
def plot_bands_with_signal(df):
    # 绘制交易图表
    #买入开仓
    long_entry = df.loc[df['signal_long']==1]['Observation']
    #卖出平仓
    long_exit = df.loc[df['signal_long']==0]['Observation']
    #卖出开仓
    short_entry = df.loc[df['signal_short']==-1]['Observation']
    #卖出平仓
    short_exit = df.loc[df['signal_short']==0]['Observation']

    fig, ax = plt.subplots(1, figsize=(15, 10), sharex=True)
    ax.plot(df['Observation'], label='Observation')
    ax.plot(df['RollingMean'], label='RollingMean')
    ax.plot(df['UpperBound'])
    ax.plot(df['LowerBound'])
    ax.fill_between(df.index, df['UpperBound'], df['LowerBound'],
                    alpha=0.3, label='Bollinger Band')

    ax.scatter(long_entry.index, long_entry, color='r',
               s=100, marker='^', label='Long Entry',
               zorder=10)
    ax.scatter(long_exit.index, long_exit, color='r',
               s=100, marker='x', label='Long Exit',
               zorder=10)
    ax.scatter(short_entry.index, short_entry, color='b',
               s=100, marker='^', label='Short Entry',
               zorder=10)
    ax.scatter(short_exit.index, short_exit, color='b',
               s=100, marker='x', label='Short Exit',
               zorder=10)
    ax.set_title('Bollinger Band Strategy Trading Signals')
    ax.legend()
    plt.show()
我们以SPY数据为例,调用上述函数。
df = pd.read_csv(r'C:\Users\mi\Desktop\SPY.csv')
df = df.set_index('Date')
df = calculate_bollinger_bands(df, 10, 2, 'Adj Close') #计算布林带
# 策略1
df1 = calculate_strategy1_position(df.copy())
df1 = calculate_returns(df1)
plot_bands_with_signal(df1)
# 策略2
df2 = calculate_strategy2_position(df.copy())
df2 = calculate_returns(df2)
plot_bands_with_signal(df2)
# 策略3
df3 = calculate_strategy3_position(df.copy())
df3 = calculate_returns(df3)
plot_bands_with_signal(df3)
可得到策略1的收益率、累积收益率、交易信号如下图所示:
可得到策略2的收益率、累积收益率、交易信号如下图所示:
可得到策略3的收益率、累积收益率、交易信号如下图所示:
欢迎关注:
Python for Finance微信公众号


