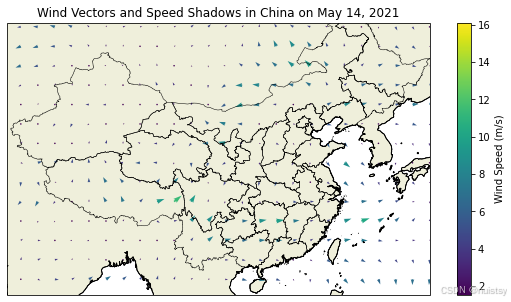
import xarray as xr
import matplotlib.pyplot as plt
import numpy as np
import geopandas as gpd
import cartopy.crs as ccrs
import cartopy.feature as cfeature

# 加载数据集
uwnd_ds = xr.open_dataset('D:/data/uwnd.2021.nc')
vwnd_ds = xr.open_dataset('D:/data/vwnd.2021.nc')

# 选择特定的时间
time_sel = '2021-05-14'

# 从数据集中提取u分量和v分量
uwnd = uwnd_ds['uwnd'].sel(time=time_sel)
vwnd = vwnd_ds['vwnd'].sel(time=time_sel)

# 计算风速模
speed = np.sqrt(uwnd**2 + vwnd**2)

# 加载中国省界shapefile
gdf = gpd.read_file('D:/data/shp文件/中国_省/中国_省2.shp')
 # 创建一个图形和轴,使用PlateCarree投影
fig, ax = plt.subplots(figsize=(10, 5), subplot_kw={'projection': ccrs.PlateCarree()})
 # 绘制省界
gdf.boundary.plot(ax=ax, color='black', linewidth=0.5)

# 添加中国的行政区划(需要额外的数据,这里只添加陆地和海岸线)
ax.add_feature(cfeature.COASTLINE, linewidth=0.5)
ax.add_feature(cfeature.LAND, edgecolor='black')

# 设置颜色映射
norm = plt.Normalize(vmin=np.percentile(speed, 5), vmax=np.percentile(speed, 95))
cmap = plt.cm.viridis  # 使用适合的颜色映射

# 绘制风矢羽
q = ax.quiver(uwnd.lon, uwnd.lat, vwnd, uwnd, speed, cmap=cmap, norm=norm,
              scale=500, width=0.004, headwidth=3, headlength=5,
              transform=ccrs.PlateCarree())

# 添加颜色条
plt.colorbar(q, label='Wind Speed (m/s)')

# 添加其他地图元素
ax.add_feature(cfeature.COASTLINE, linewidth=0.5)
ax.set_title('Wind Vectors and Speed Shadows in China on May 14, 2021')
ax.set_extent([73, 135, 18, 53], crs=ccrs.PlateCarree())  # 设置地图范围

# 显示图形
plt.show()

