功能说明
-
杭州市边界:通过加载 GeoJSON 文件显示杭州市的边界。
-
自定义地图底图:通过结合天地图实现自定义底图
-
坐标点位:在地图上显示一些固定的坐标点。
-
点位聚合:当多个点位距离较近时,会自动聚合成一个点,并显示聚合点中的点位数量。
-
点位散发:点击聚合点时,会弹出一个提示框,显示聚合点中包含的所有点位名称。
1. 引入 OpenLayers 库
在 HTML 文件中引入 OpenLayers 库。官网:OpenLayers - Welcome
<!DOCTYPE html>
<html lang="en">
<head>
    <meta charset="UTF-8">
    <meta name="viewport" content="width=device-width, initial-scale=1.0">
    <title>OpenLayers Map with Hangzhou Boundary</title>
    <link rel="stylesheet" href="https://cdn.jsdelivr.net/npm/[email protected]/ol.css">
    <style>
        #map {
            width: 100%;
            height: 600px;
        }
    </style>
</head>
<body>
    <div id="map"></div>
    <script src="https://cdn.jsdelivr.net/npm/[email protected]/dist/ol.js"></script>
    <script src="main.js"></script>
</body>
</html>
2. 创建地图并添加杭州市边界
编写 JavaScript 代码来创建地图并添加杭州市边界。
2.1 准备杭州市边界的 GeoJSON 数据
你需要准备一个包含杭州市边界的 GeoJSON 文件。可以从公开的地理数据源(如 Natural Earth 或 GADM)获取杭州市的边界数据。或者DataV.GeoAtlas地理小工具系列获取(记得把文件格式化)确保它与 HTML 文件在同一目录下
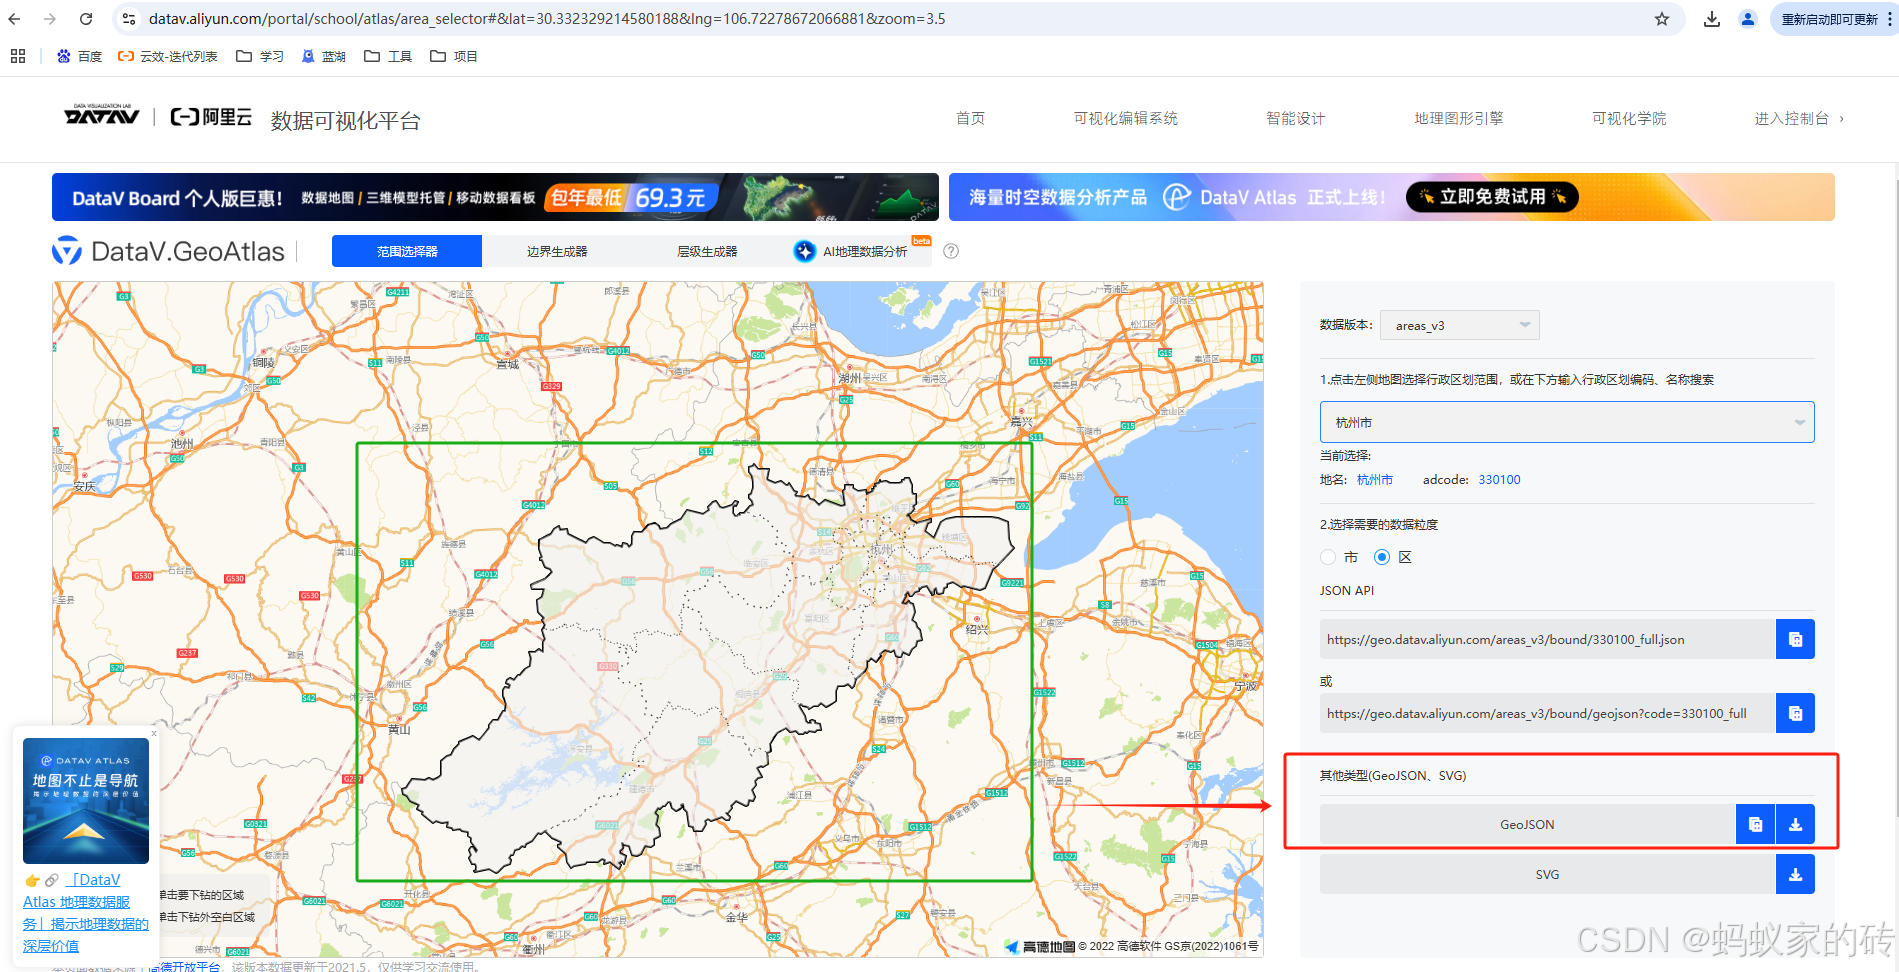
2.2 添加杭州市边界和坐标点
// 创建地图
const map = new ol.Map({
    target: 'map',
    layers: [
        new ol.layer.Tile({
            source: new ol.source.OSM() // 使用 OpenStreetMap 作为底图
        })
    ],
    view: new ol.View({
        center: ol.proj.fromLonLat([120.1551, 30.2741]), // 杭州市的中心坐标
        zoom: 9
    })
});

// 添加杭州市边界
const hangzhouBoundary = new ol.layer.Vector({
    source: new ol.source.Vector({
        url: 'hangzhou-boundary.geojson', // 杭州市边界的 GeoJSON 文件
        format: new ol.format.GeoJSON()
    }),
    style: new ol.style.Style({
        stroke: new ol.style.Stroke({
            color: 'blue',
            width: 2
        }),
        fill: new ol.style.Fill({
            color: 'rgba(0, 0, 255, 0.1)' // 边界填充颜色
        })
    })
});

map.addLayer(hangzhouBoundary);

// 添加一些坐标点位
const points = [
    { lon: 120.1551, lat: 30.2741, name: 'West Lake' },
    { lon: 120.2108, lat: 30.2466, name: 'Qiantang River' },
    { lon: 120.1236, lat: 30.2295, name: 'Xixi Wetland' },
    { lon: 120.2000, lat: 30.3000, name: 'Downtown' },
    // 添加更多点位...
];

const pointFeatures = points.map(point => {
    const feature = new ol.Feature({
        geometry: new ol.geom.Point(ol.proj.fromLonLat([point.lon, point.lat]))
    });
    feature.set('name', point.name);
    return feature;
});

const pointSource = new ol.source.Vector({
    features: pointFeatures
});

const pointLayer = new ol.layer.Vector({
    source: pointSource,
    style: new ol.style.Style({
        image: new ol.style.Circle({
            radius: 5,
            fill: new ol.style.Fill({
                color: 'red'
            })
        })
    })
});

map.addLayer(pointLayer);

// 添加点位聚合功能
const clusterSource = new ol.source.Cluster({
    distance: 40, // 聚合距离
    source: pointSource
});

const clusterLayer = new ol.layer.Vector({
    source: clusterSource,
    style: function(feature) {
        const size = feature.get('features').length;
        return new ol.style.Style({
            image: new ol.style.Circle({
                radius: 10 + Math.min(size, 10), // 根据点位数量调整聚合点大小
                fill: new ol.style.Fill({
                    color: 'rgba(255, 0, 0, 0.5)'
                })
            }),
            text: new ol.style.Text({
                text: size.toString(), // 显示聚合点数量
                fill: new ol.style.Fill({
                    color: '#fff'
                })
            })
        });
    }
});

map.addLayer(clusterLayer);

// 添加点位的散发功能
map.on('click', function(event) {
    const features = map.getFeaturesAtPixel(event.pixel);
    if (features.length > 0) {
        const feature = features[0];
        if (feature.get('features')) {
            // 如果是聚合点,展开显示其中的单个点位
            const originalFeatures = feature.get('features');
            alert(`聚合点包含以下点位:\n${
                originalFeatures.map(f => f.get('name')).join('\n')
            }`);
        } else {
            // 如果是单个点位,显示点位名称
            alert(`点位名称:${feature.get('name')}`);
        }
    }
});
3.结合天地图
如果你想使用 天地图 作为底图,而不是 OpenStreetMap,可以通过加载天地图的 WMTS 或 XYZ 服务来实现。天地图提供了多种地图服务,包括矢量地图、影像地图和注记图层等。
以下是使用天地图作为底图,并在地图上添加坐标点位的完整示例。
3.1 准备天地图信息(天地图密钥,天地图矢量地图服务 URL)
3.2 创建天地图矢量图层,
3.3 创建天地图注记图层
3.4 创建矢量图层
3.5 将点位添加到矢量图层
  // 天地图密钥(请替换为你自己的密钥)
        const tiandituKey = '你的天地图密钥';

        // 天地图矢量地图服务 URL
        const tiandituVecUrl = `https://t0.tianditu.gov.cn/vec_w/wmts?tk=${tiandituKey}`;
        const tiandituCvaUrl = `https://t0.tianditu.gov.cn/cva_w/wmts?tk=${tiandituKey}`;

        // 创建天地图矢量图层
        const tiandituVecLayer = new ol.layer.Tile({
            source: new ol.source.WMTS({
                url: tiandituVecUrl,
                layer: 'vec',
                matrixSet: 'w',
                format: 'tiles',
                style: 'default',
                projection: 'EPSG:3857',
                tileGrid: new ol.tilegrid.WMTS({
                    origin: [-20037508.342789244, 20037508.342789244],
                    resolutions: [
                        156543.03392804097,
                        78271.51696402048,
                        39135.75848201024,
                        19567.87924100512,
                        9783.93962050256,
                        4891.96981025128,
                        2445.98490512564,
                        1222.99245256282,
                        611.49622628141,
                        305.748113140705,
                        152.8740565703525,
                        76.43702828517625,
                        38.21851414258813,
                        19.109257071294063,
                        9.554628535647032,
                        4.777314267823516,
                        2.388657133911758,
                        1.194328566955879,
                        0.5971642834779395
                    ],
                    matrixIds: [0, 1, 2, 3, 4, 5, 6, 7, 8, 9, 10, 11, 12, 13, 14, 15, 16, 17, 18]
                })
            })
        });

        // 创建天地图注记图层
        const tiandituCvaLayer = new ol.layer.Tile({
            source: new ol.source.WMTS({
                url: tiandituCvaUrl,
                layer: 'cva',
                matrixSet: 'w',
                format: 'tiles',
                style: 'default',
                projection: 'EPSG:3857',
                tileGrid: new ol.tilegrid.WMTS({
                    origin: [-20037508.342789244, 20037508.342789244],
                    resolutions: [
                        156543.03392804097,
                        78271.51696402048,
                        39135.75848201024,
                        19567.87924100512,
                        9783.93962050256,
                        4891.96981025128,
                        2445.98490512564,
                        1222.99245256282,
                        611.49622628141,
                        305.748113140705,
                        152.8740565703525,
                        76.43702828517625,
                        38.21851414258813,
                        19.109257071294063,
                        9.554628535647032,
                        4.777314267823516,
                        2.388657133911758,
                        1.194328566955879,
                        0.5971642834779395
                    ],
                    matrixIds: [0, 1, 2, 3, 4, 5, 6, 7, 8, 9, 10, 11, 12, 13, 14, 15, 16, 17, 18]
                })
            })
        });

        // 点位数据(经纬度坐标,EPSG:4326)
        const points = [
            { lon: 121.12, lat: 28.82, name: 'Point 1' },
            { lon: 121.18, lat: 28.87, name: 'Point 2' },
            { lon: 121.14, lat: 28.84, name: 'Point 3' }
        ];

        // 创建矢量图层
        const vectorLayer = new ol.layer.Vector({
            source: new ol.source.Vector(),
            style: new ol.style.Style({
                image: new ol.style.Circle({
                    radius: 5,
                    fill: new ol.style.Fill({ color: 'red' })
                }),
                text: new ol.style.Text({
                    text: '', // 动态设置
                    offsetY: -10,
                    fill: new ol.style.Fill({ color: 'black' })
                })
            })
        });

        // 将点位添加到矢量图层
        points.forEach(point => {
            const pointFeature = new ol.Feature({
                geometry: new ol.geom.Point(ol.proj.fromLonLat([point.lon, point.lat])) // 转换为 EPSG:3857
            });

            // 设置点位名称
            pointFeature.set('name', point.name);

            // 动态设置样式
            pointFeature.setStyle(new ol.style.Style({
                image: new ol.style.Circle({
                    radius: 5,
                    fill: new ol.style.Fill({ color: 'red' })
                }),
                text: new ol.style.Text({
                    text: point.name,
                    offsetY: -10,
                    fill: new ol.style.Fill({ color: 'black' })
                })
            }));

            vectorLayer.getSource().addFeature(pointFeature);
        });

        // 创建地图
        const map = new ol.Map({
            target: 'map',
            layers: [
                tiandituVecLayer, // 天地图矢量地图
                tiandituCvaLayer, // 天地图注记图层
                vectorLayer // 点位图层
            ],
            view: new ol.View({
                center: ol.proj.fromLonLat([121.15, 28.85]), // 转换为 EPSG:3857
                zoom: 10
            })
        });
代码说明
-
天地图服务:
-
使用
WMTS服务加载天地图的矢量地图(vec_w)和注记图层(cva_w)。 -
需要提供天地图的密钥(
tk)。
-
-
点位数据:
-
点位数据使用经纬度坐标(
EPSG:4326),通过ol.proj.fromLonLat转换为EPSG:3857。
-
-
地图视图:
-
地图的中心点坐标也需要通过
ol.proj.fromLonLat转换。
-
-
矢量图层:
-
点位使用
ol.style.Circle表示,并带有名称标签。
-
注意事项
-
密钥替换:
-
将代码中的
你的天地图密钥替换为你从天地图官网获取的实际密钥。
-
-
服务限制:
-
天地图的服务可能有访问频率限制,请遵守天地图的使用条款。
-
-
其他地图服务:
-
如果需要使用天地图的影像地图,可以将
vec_w替换为img_w,cva_w替换为cia_w。
-
通过以上方法,你可以成功使用天地图作为底图,并在地图上显示正确的点位。
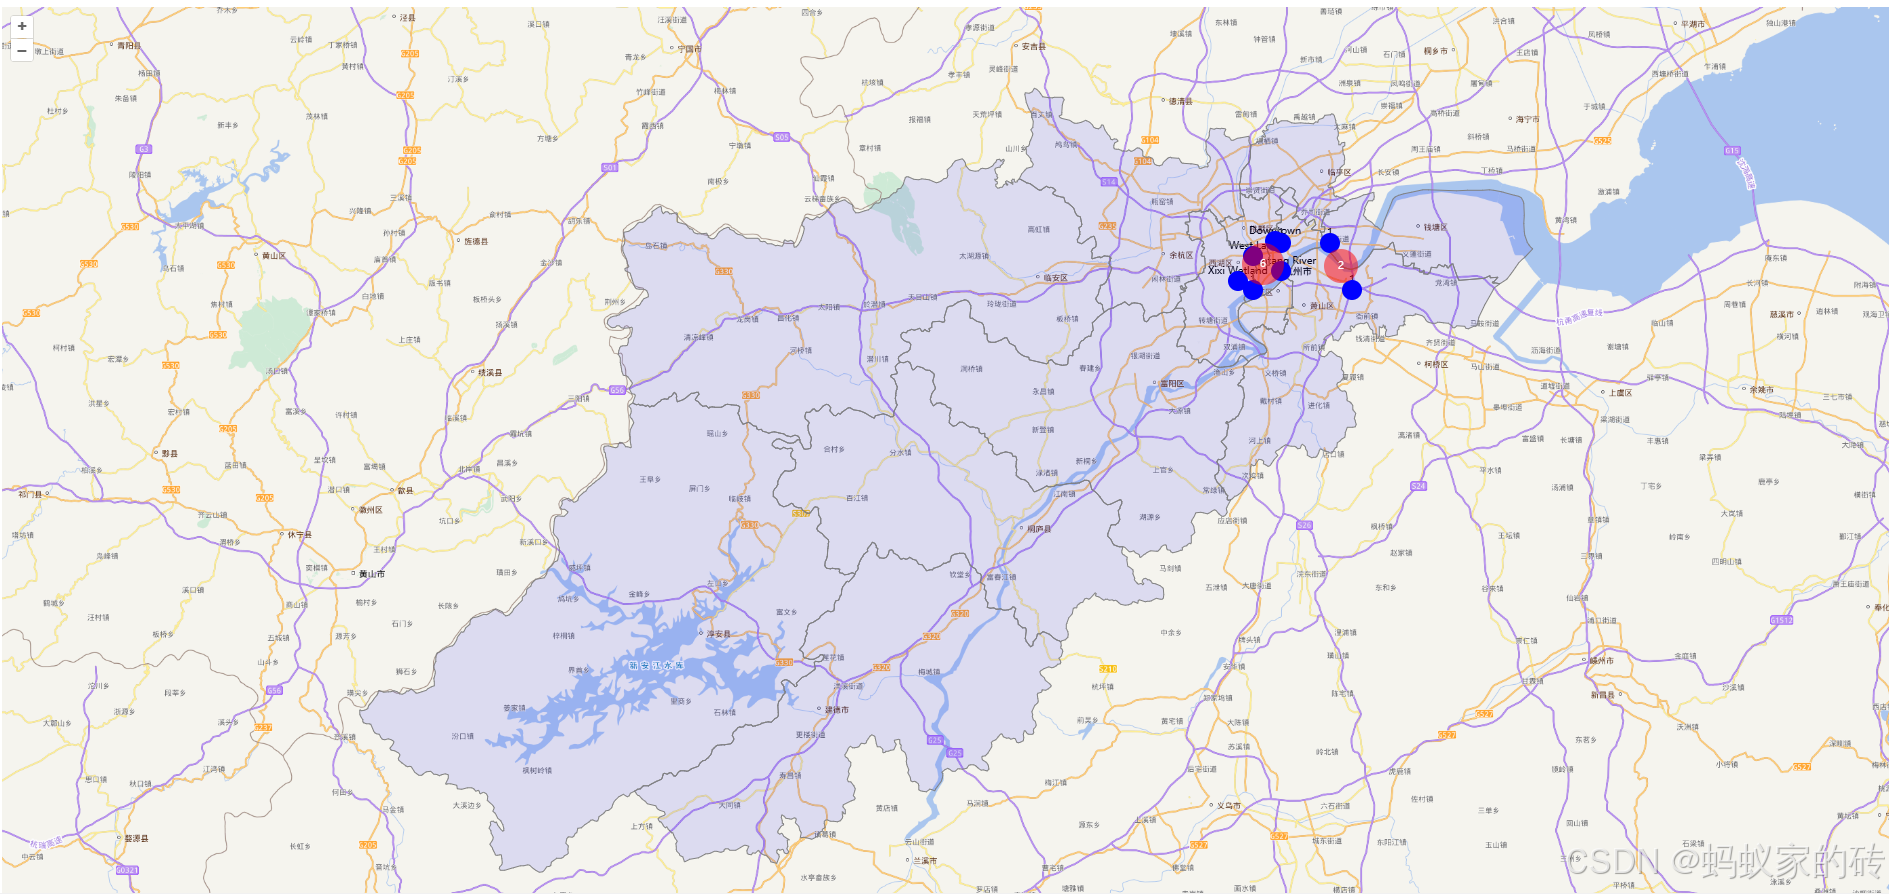
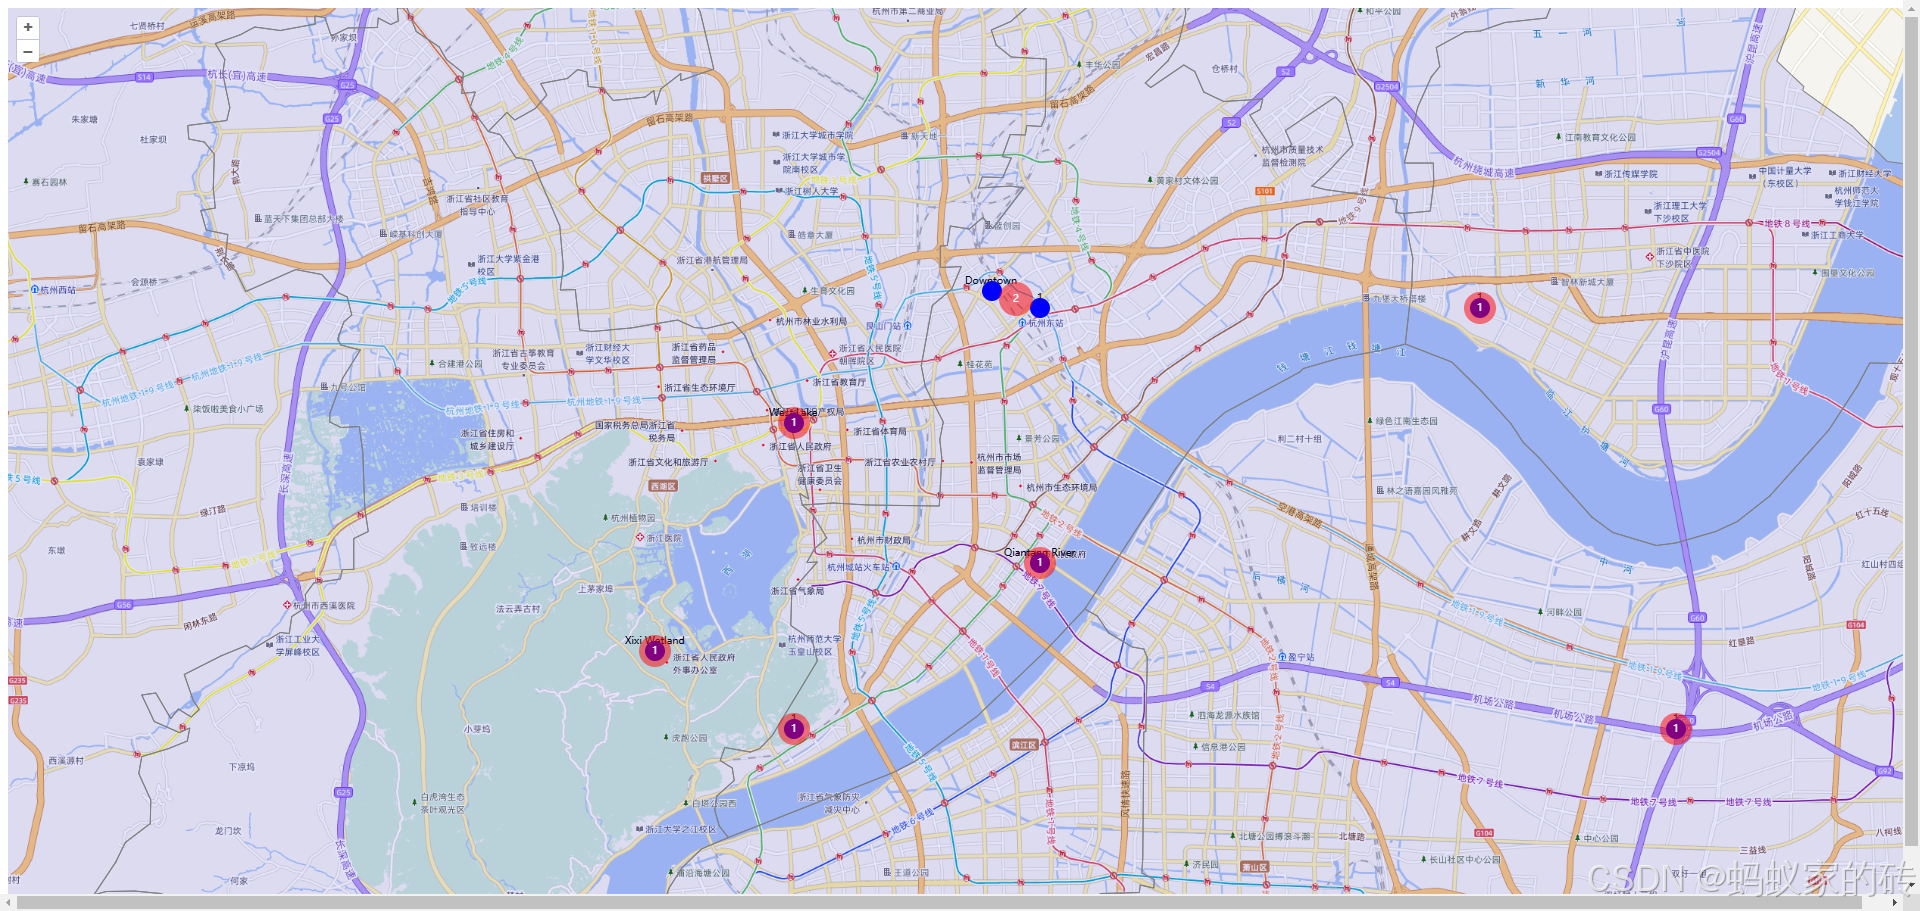
4. 运行代码
将上述代码保存并在浏览器中打开 index.html。你将看到一个包含杭州市边界、坐标点位以及点位聚合功能的地图。
全部代码如下:
<!DOCTYPE html>
<html lang="en">
<head>
    <meta charset="UTF-8">
    <meta name="viewport" content="width=device-width, initial-scale=1.0">
    <title>OpenLayers Map with linHai Boundary</title>
    <link rel="stylesheet" href="https://cdn.jsdelivr.net/npm/[email protected]/ol.css">
    <style>
        #map {
            width: 100vw;
            height: 100vh;
        }
    </style>
</head>
<body>
    <div id="map"></div>
    <script src="https://cdn.jsdelivr.net/npm/[email protected]/dist/ol.js"></script>
    <script src="main.js"></script>
    <script>


// 自定义底图
const tiandituKey = 'xxxxxxxxxx';// 天地图密钥(请替换为你自己的密钥)
// 天地图矢量地图服务 URL
const tiandituVecUrl = `https://t0.tianditu.gov.cn/vec_w/wmts?tk=${tiandituKey}`;
const tiandituCvaUrl = `https://t0.tianditu.gov.cn/cva_w/wmts?tk=${tiandituKey}`;


// 添加一些坐标点位
const points = [
{ lon: 120.1551, lat: 30.2741, name: 'West Lake' },
{ lon: 120.2108, lat: 30.2466, name: 'Qiantang River' },
{ lon: 120.1236, lat: 30.2295, name: 'Xixi Wetland' },
{ lon: 120.2000, lat: 30.3000, name: 'Downtown' },

{ lon: 120.1551, lat: 30.2141, name: '1' },
{ lon: 120.2108, lat: 30.2966, name: '1' },
{ lon: 120.1236, lat: 20.2295, name: '1'  },
{ lon: 120.2000, lat: 20.3000, name: '1'  },

{ lon: 120.3551, lat: 30.2141, name: '1'  },
{ lon: 120.3108, lat: 30.2966, name: '1'  },
{ lon: 120.3236, lat: 20.2295, name: '1'  },
{ lon: 120.4000, lat: 20.3000, name: '1'  },
];
// 创建天地图矢量图层
const tiandituVecLayer = new ol.layer.Tile({
    source: new ol.source.WMTS({
        url: tiandituVecUrl,
        layer: 'vec',
        matrixSet: 'w',
        format: 'tiles',
        style: 'default',
        projection: 'EPSG:3857',
        tileGrid: new ol.tilegrid.WMTS({
            origin: [-20037508.342789244, 20037508.342789244],
            resolutions: [
            //地图的元素
                156543.03392804097,
                78271.51696402048,
                39135.75848201024,
                19567.87924100512,
                9783.93962050256,
                4891.96981025128,
                2445.98490512564,
                1222.99245256282,
                611.49622628141,
                305.748113140705,
                152.8740565703525,
                76.43702828517625,
                38.21851414258813,
                19.109257071294063,
                9.554628535647032,
                4.777314267823516,
                2.388657133911758,
                1.194328566955879,
                0.5971642834779395
            ],
            matrixIds: [0, 1, 2, 3, 4, 5, 6, 7, 8, 9, 10, 11, 12, 13, 14, 15, 16, 17, 18]
        })
    })
});

// 创建天地图注记图层
const tiandituCvaLayer = new ol.layer.Tile({
    source: new ol.source.WMTS({
        url: tiandituCvaUrl,
        layer: 'cva',
        matrixSet: 'w',
        format: 'tiles',
        style: 'default',
        projection: 'EPSG:3857',
        tileGrid: new ol.tilegrid.WMTS({
            origin: [-20037508.342789244, 20037508.342789244],
            resolutions: [
            //地图的元素
                156543.03392804097,
                78271.51696402048,
                39135.75848201024,
                19567.87924100512,
                9783.93962050256,
                4891.96981025128,
                2445.98490512564,
                1222.99245256282,
                611.49622628141,
                305.748113140705,
                152.8740565703525,
                76.43702828517625,
                38.21851414258813,
                19.109257071294063,
                9.554628535647032,
                4.777314267823516,
                2.388657133911758,
                1.194328566955879,
                0.5971642834779395
            ],
            matrixIds: [0, 1, 2, 3, 4, 5, 6, 7, 8, 9, 10, 11, 12, 13, 14, 15, 16, 17, 18]
        })
    })
});

// 创建矢量图层
const vectorLayer = new ol.layer.Vector({
    source: new ol.source.Vector(),
    style: new ol.style.Style({
        image: new ol.style.Circle({
            radius: 5,
            fill: new ol.style.Fill({ color: 'red' })
        }),
        text: new ol.style.Text({
            text: '', // 动态设置
            offsetY: -10,
            fill: new ol.style.Fill({ color: 'black' })
        })
    })
});

// 将点位添加到矢量图层
points.forEach(point => {
    const pointFeature = new ol.Feature({
        geometry: new ol.geom.Point(ol.proj.fromLonLat([point.lon, point.lat])) // 转换为 EPSG:3857
    });

    // 设置点位名称
    pointFeature.set('name', point.name);

    // 动态设置样式
    pointFeature.setStyle(new ol.style.Style({
        image: new ol.style.Circle({
            radius: 5,
            fill: new ol.style.Fill({ color: 'red' })
        }),
        // 也可以自定义图片
        // image: new ol.style.Icon({
        //       src: './assets/pointer.png',
        //       scale: 0.4,
        //       anchor: [59.5, 119], // 锚点位置 [x, y],单位为像素,重要!!!否则放大缩小会错位
        //       anchorXUnits: 'pixels', // 锚点x单位
        //       anchorYUnits: 'pixels', // 锚点y单位
        // }),
        text: new ol.style.Text({
            text: point.name,
            offsetY: -10,
            fill: new ol.style.Fill({ color: 'black' })
        })
    }));

    vectorLayer.getSource().addFeature(pointFeature);
});


// 创建地图
const map = new ol.Map({
    target: 'map',
    layers: [
        tiandituVecLayer, // 天地图矢量地图
        tiandituCvaLayer, // 天地图注记图层
        vectorLayer // 点位图层
    ],
    view: new ol.View({
        center: ol.proj.fromLonLat([120.1551, 30.2741]), // 杭州市的中心坐标
        zoom: 11,
		minZoom: 6,
		maxZoom: 18,
		}),
		showFullExtent: true,
});


// 添加杭州市边界
const hangzhouBoundary = new ol.layer.Vector({
    source: new ol.source.Vector({
        url: 'boundary.geojson', // 杭州市边界的 GeoJSON 文件
        format: new ol.format.GeoJSON()
    }),
    style: new ol.style.Style({
        stroke: new ol.style.Stroke({
            color: 'gray',
            width: 1
        }),
        fill: new ol.style.Fill({
            color: 'rgba(0, 0, 255, 0.1)' // 边界填充颜色
        })
    })
});

map.addLayer(hangzhouBoundary);


const pointFeatures = points.map(point => {
    const feature = new ol.Feature({
        geometry: new ol.geom.Point(ol.proj.fromLonLat([point.lon, point.lat]))
    });
    feature.set('name', point.name);
    return feature;
});

const pointSource = new ol.source.Vector({
    features: pointFeatures
});

const pointLayer = new ol.layer.Vector({
    source: pointSource,
    style: new ol.style.Style({
        image: new ol.style.Circle({
            radius: 10,
            fill: new ol.style.Fill({
                color: 'blue'
            })
        })
    })
});

map.addLayer(pointLayer);

// 添加点位聚合功能
const clusterSource = new ol.source.Cluster({
    distance: 50, // 聚合距离
    source: pointSource
});

const clusterLayer = new ol.layer.Vector({
    source: clusterSource,
    style: function(feature) {
        const size = feature.get('features').length;
        return new ol.style.Style({
            image: new ol.style.Circle({
                radius: 15 + Math.min(size, 15), // 根据点位数量调整聚合点大小
                fill: new ol.style.Fill({
                    color: 'rgba(255, 0, 0, 0.5)'
                })
            }),
            text: new ol.style.Text({
                text: size.toString(), // 显示聚合点数量
                fill: new ol.style.Fill({
                    color: '#fff'
                })
            })
        });
    }
});

map.addLayer(clusterLayer);

// 添加点位的散发功能
map.on('click', function(event) {
    const features = map.getFeaturesAtPixel(event.pixel);
    if (features.length > 0) {
        const feature = features[0];
        if (feature.get('features')) {
            // 如果是聚合点,展开显示其中的单个点位
            const originalFeatures = feature.get('features');
            alert(`聚合点包含以下点位:\n${originalFeatures.map(f => f.get('name')).join('\n')}`);
        } else {
            // 如果是单个点位,显示点位名称
            alert(`点位名称:${feature.get('name')}`);
        }
    }
});

</script>
</body>
</html>