Python基于预训练模型对时间系列数据的未来进行预测
导入库
%matplotlib inline
import matplotlib.pyplot as plt
import numpy as np
import pandas as pd
import torch
from chronos import ChronosPipeline
from tqdm.auto import tqdm
from autogluon.timeseries import TimeSeriesDataFrame, TimeSeriesPredictor

plt.rcParams['axes.unicode_minus'] = False
# 设置 pandas 显示选项以显示所有列
pd.set_option('display.max_columns', None)
pd.set_option('display.max_rows', None)
pd.set_option('display.max_colwidth', None)
[2024-10-24 23:21:51,383] [INFO] [real_accelerator.py:203:get_accelerator] Setting ds_accelerator to cuda (auto detect)
 [WARNING]  Please specify the CUTLASS repo directory as environment variable $CUTLASS_PATH
 [WARNING]  sparse_attn requires a torch version >= 1.5 and < 2.0 but detected 2.3
 [WARNING]  using untested triton version (2.3.1), only 1.0.0 is known to be compatible
2024-10-24 23:21:53.611268: I tensorflow/core/util/port.cc:113] oneDNN custom operations are on. You may see slightly different numerical results due to floating-point round-off errors from different computation orders. To turn them off, set the environment variable `TF_ENABLE_ONEDNN_OPTS=0`.
2024-10-24 23:21:53.651005: I tensorflow/core/platform/cpu_feature_guard.cc:210] This TensorFlow binary is optimized to use available CPU instructions in performance-critical operations.
To enable the following instructions: AVX2 AVX512F AVX512_VNNI FMA, in other operations, rebuild TensorFlow with the appropriate compiler flags.
2024-10-24 23:21:54.471208: W tensorflow/compiler/tf2tensorrt/utils/py_utils.cc:38] TF-TRT Warning: Could not find TensorRT
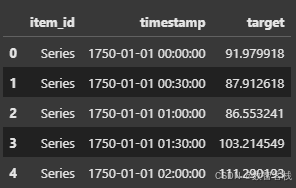
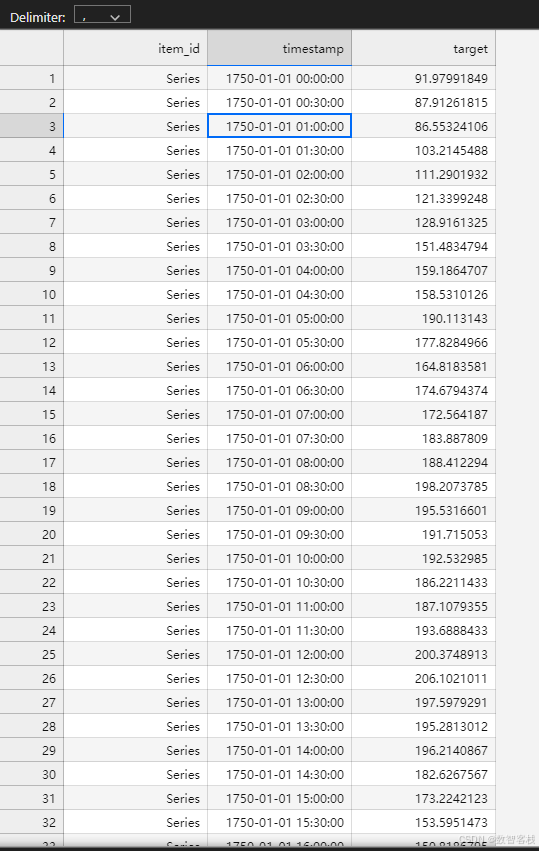
df = pd.read_csv("anomalySeries.csv")
plt.figure(figsize=(15, 4))
plt.plot( df.target)   # [-500:]
plt.grid()
plt.show()
df.head()
Chronos 是基于语言模型架构的预训练时间序列预测模型系列。时间序列通过缩放和量化转换为一系列标记,并使用交叉熵损失在这些标记上训练语言模型。训练完成后,通过根据历史背景对多个未来轨迹进行采样,即可获得概率预测。Chronos 模型已在大量公开可用的时间序列数据以及使用高斯过程生成的合成数据上进行了训练。
# 指定本地模型路径
model_path = "models/amazon/chronos-t5-base"
pipeline = ChronosPipeline.from_pretrained(  # 时间序列预测的模型管道类
  model_path,   # 预训练模型
  device_map="cuda",
  torch_dtype=torch.bfloat16, # 用于在计算效率和精度之间取得平衡
)
context = torch.tensor(df["target"])
prediction_length = 24
forecast = pipeline.predict(context, prediction_length)  # shape [num_series, num_samples, prediction_length]
# visualize the forecast
forecast_index = range(len(df), len(df) + prediction_length)
low, median, high = np.quantile(forecast[0].numpy(), [0.1, 0.5, 0.9], axis=0)

plt.figure(figsize=(15, 4))
plt.plot(df["target"], color="royalblue", label="historical data")
plt.plot(forecast_index, median, color="tomato", label="median forecast")
plt.fill_between(forecast_index, low, high, color="tomato", alpha=0.3, label="80% prediction interval")
plt.legend()
plt.grid()
plt.show()
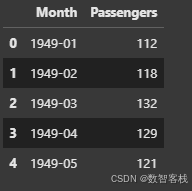
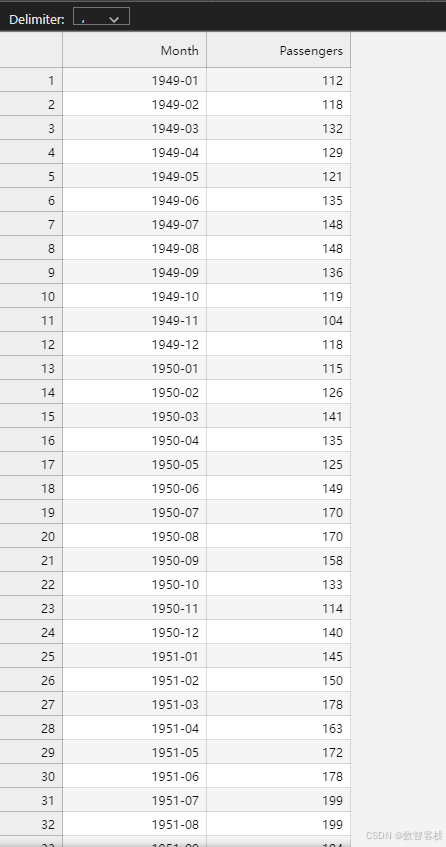
df2 = pd.read_csv("international-airline-passengers.csv")
df2.head()
plt.figure(figsize=(15, 4))
plt.plot(df2["Passengers"].values)
plt.grid()
plt.show()
context = torch.tensor(df2["Passengers"])
prediction_length = 24
forecast = pipeline.predict(context, prediction_length)  # shape [num_series, num_samples, prediction_length]

# visualize the forecast
forecast_index = range(len(df2), len(df2) + prediction_length)
low, median, high = np.quantile(forecast[0].numpy(), [0.1, 0.5, 0.9], axis=0)

plt.figure(figsize=(15, 4))
plt.plot(df2["Passengers"], color="royalblue", label="historical data")
plt.plot(forecast_index, median, color="tomato", label="median forecast")
plt.fill_between(forecast_index, low, high, color="tomato", alpha=0.3, label="80% prediction interval")
plt.legend()
plt.grid()
plt.show()


