MetaPhlAn2是分析微生物群落(细菌、古菌、真核生物和病毒)组成的工具,它在宏基因组研究中非常有用,只需一条完命令即可获得微生物的物种丰度信息(扩增子物种组成需要质控、拼接、拆样本、切除引物、比对等步骤,此软件居然分析宏基因组这么方便)。同时配合自带的脚本可进一步统计和可视化。
主页:http://segatalab.cibio.unitn.it/tools/metaphlan2/
MetaPhlAn2可以基于宏基因组数据,获得微生物群体中种水平精度的组成,包括细菌、古菌、真核生物和病毒。如果有株水平基因组的物种,也可以追踪和研究。
MetaPhlAn2整理了超过17000个参考基因组,包括13500个细菌和古菌,3500个病毒和110种真核生物,汇编整理了100万+类群特异的标记基因,可以实现:
-
精确的分类群分配
-
准确估计物种的相对丰度
-
种水平精度
-
株鉴定与追踪
-
超快的分析速度
软件 2015年发表于Nature Method,截止18年4月21日Google Scholar统计引用183次。该软件通讯作者为意大利特兰托大学的助理教授Nicola Segata的计算宏基因组实验室,己发表68篇文章,发表和维护的软件有14个,其中著名的有MetaPhlAn2, GraPhlAn, LEfSe, ShortBRED, MicroPITA, HUMAnN等。如果你对他不熟悉,那一定听説过他的博后老板Curtis Huttenhower(Picrust, Lefse通讯作者)。
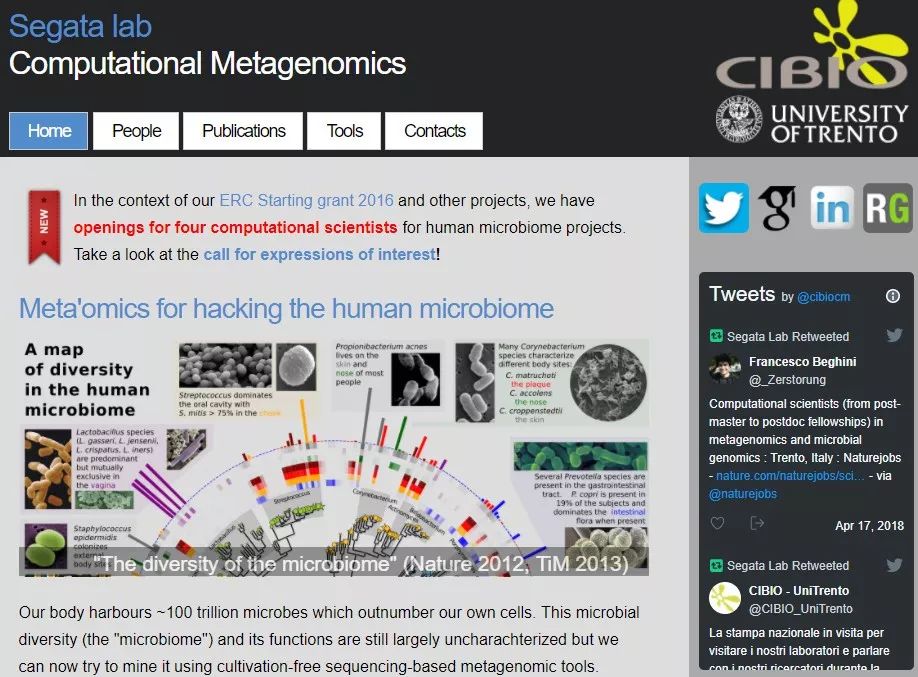
实验室主页: http://segatalab.cibio.unitn.it
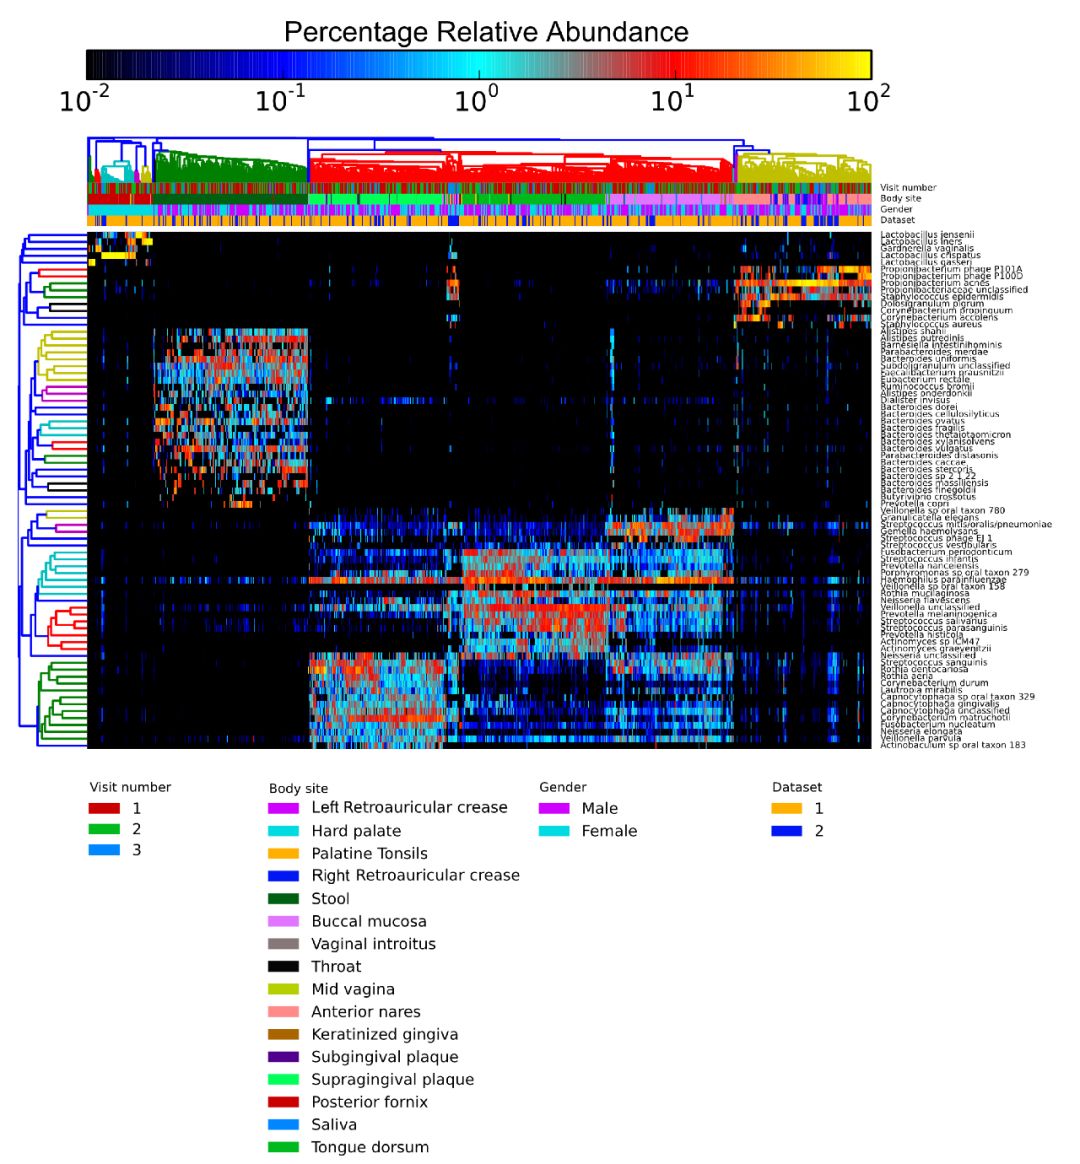
看看软件主要能干什么
分析人类微生物组数据,微生物和样本进行层级聚类
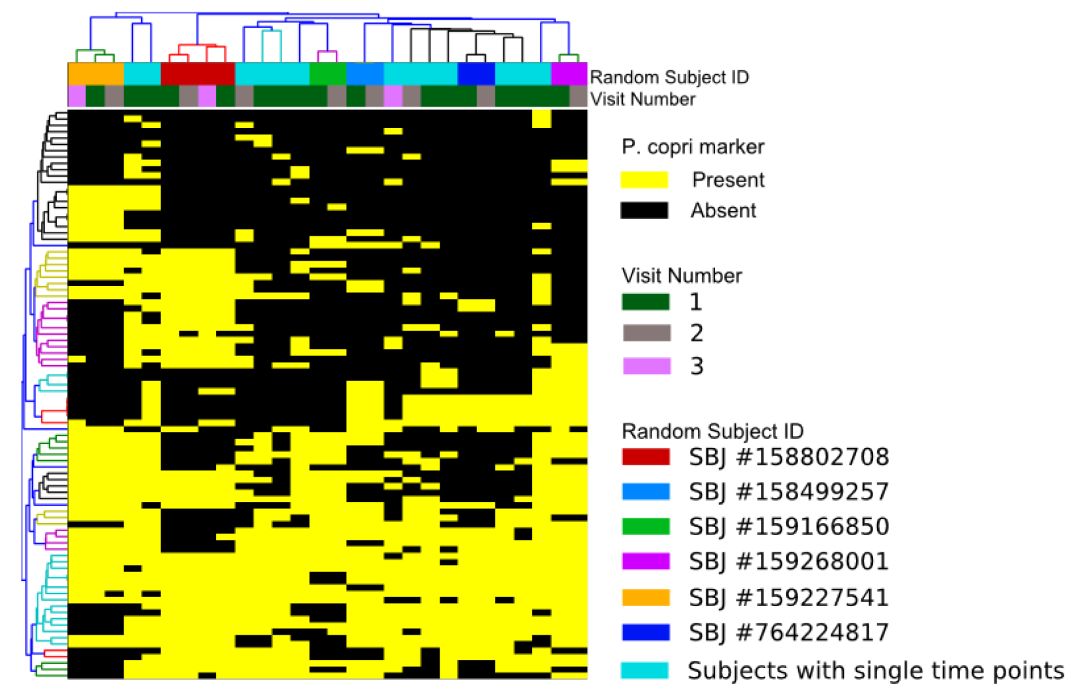
人类微生物组数据多时间点普氏菌属株水平的指纹
软件安装
优秀的是软件是一直在更新维护的,几年都没更新的软件,如果还有更好的选择就不建议使用。
此软件一直在更新维护,最近一次更新是两周前。
软件仓库:https://bitbucket.org/biobakery/metaphlan2/overview
依赖关系说明
软件依赖python2.7+和numpy包,同时居然支持python3。
如果使用Bowtie2结果为输入文件,则无任何依赖关系。
utils/metaphlan_hclust_heatmap.py脚本绘制热图时,依赖matplotlib包
如果想输出biom格式结果,需要安装R包biom
结果的进一步可视化,如使用hclust2和GraPhlAn请参考相关软件安装说明
下载和安装代码
请学习时下载安装最新版,如下代码仅为本文章作者学习此软件时的版本,仅供参考。主要包括下载、解压、添加环境变量。
wget https://bitbucket.org/biobakery/metaphlan2/get/default.zip
unzip default.zip
mv biobakery-metaphlan2-5175d8783801 metaphlan2
cd metaphlan2/
export PATH=`pwd`:`pwd`/utils:$PATH
export mpa_dir=`pwd`
metaphlan2.py -v # MetaPhlAn version 2.7.6    (5 March 2018)
使用实例
定量物种谱
大家都知道扩增子分析前期处理步骤复杂,宏基因组分析应该更复杂,但此软件却是例外,操作简单,一条例命令从原始数据拿到物种谱(相当于标准化后的OTU表)。是不是很牛B。
而且作者考虑了不同用户的需求,有多种使用情况下都可用,下面多种方法根据自己的输入文件格式任选其一。
如果输入文件是fastq,需要依赖bowtie2安装好
metaphlan2.py metagenome.fastq --input_type fastq > profiled_metagenome.txt推荐输出bowtie2的比对结果,方便下次快速重新计算,并使用多线程-nproc
metaphlan2.py metagenome.fastq --bowtie2out metagenome.bowtie2.bz2 --nproc 9 --input_type fastq > profiled_metagenome.txt也可以使用bowtie2输出文件
metaphlan2.py metagenome.bowtie2.bz2 --nproc 5 --input_type bowtie2out > profiled_metagenome.txt也可以分别进行比对和定量
bowtie2 --sam-no-hd --sam-no-sq --no-unal --very-sensitive -S metagenome.sam -x ${mpa_dir}/databases/mpa_v20_m200 -U metagenome.fastq
metaphlan2.py metagenome.sam --input_type sam > profiled_metagenome.txt
最常用的是使用双端压缩fastq文件,但并不考虑配对信息
metaphlan2.py --input_type fastq <(zcat metagenome_1.fq.gz metagenome_2.fq.gz) > profiled_metagenome.txt最好调用多线程,并输出比较结果
metaphlan2.py --bowtie2out metagenome.bowtie2.bz2 --nproc 9 --input_type fastq <(zcat metagenome_1.fq.gz metagenome_2.fq.gz) > profiled_metagenome1.txt第一次使用,程序会自己下载数据库至安装目录中,并进行校验、解压、解压、bowtie2建索引,根据网速和服务器性能可能需要很长时间1-N小时。
输出结果为各层级物种相对丰度值,有点像lefse的输入文件格式(方便lefse下游差异分析)
#SampleID    Metaphlan2_Analysis
k__Bacteria    100.0
k__Bacteria|p__Actinobacteria    49.91104
k__Bacteria|p__Proteobacteria    46.00995
k__Bacteria|p__Firmicutes    2.45456
k__Bacteria|p__Bacteroidetes    0.99062
k__Bacteria|p__Cyanobacteria    0.63383
k__Bacteria|p__Actinobacteria|c__Actinobacteria    49.91104
k__Bacteria|p__Proteobacteria|c__Alphaproteobacteria    22.82115
k__Bacteria|p__Proteobacteria|c__Betaproteobacteria    16.60788
多个样品批处理
假如我们有25-28一共4个样本,调用for循环并转后台并行处理
cd ~/project
for i in `seq 25 28`;do
metaphlan2.py --nproc 9 --input_type fastq <(zcat Sample_${i}.rmhost.1.fq.gz Sample_${i}.rmhost.2.fq.gz) > metaphlan2_${i}.txt &
done
个人使用上面命令处理输入文件为压缩格式fastq时,偶尔会出错,帮修改为下面两步法分别比对和生成表格,更保险
for i in `seq 25 28`;do
bowtie2 -p 9 --sam-no-hd --sam-no-sq --no-unal --very-sensitive -S temp_${i}.sam -x ~/software/metaphlan2/databases/mpa_v20_m200 -U Sample_${i}.rmhost.1.fq.gz,Sample_${i}.rmhost.2.fq.gz &
done

for i in `seq 25 28`;do
metaphlan2.py temp_${i}.sam --input_type sam > metaphlan2_${i}.txt &
done
样品物种谱合并
merge_metaphlan_tables.py命令可以将每个样品结果表合并,程序位于程序的utils目录中,请自行添加环境变量或使用绝对路径。合并时支持输入文件多个文件空格分隔,或使用通配符(如下)。可结合sed删除样本名中共有部分,精简样品名方便可视化简洁美观
merge_metaphlan_tables.py metaphlan2*.txt | sed 's/metaphlan2_//g' > merged_metaphlan2.txt获得了矩阵表,下面可以进行各种统计分析与可视化啦!
ID    25    26    27    28
#SampleID    Metaphlan2_Analysis    Metaphlan2_Analysis    Metaphlan2_Analysis    Metaphlan2_Analysis
k__Bacteria    100.0    100.0    100.0    100.0
k__Bacteria|p__Actinobacteria    49.91104    45.2479    54.37222    48.77918
k__Bacteria|p__Actinobacteria|c__Actinobacteria    49.91104    45.2479    54.37222    48.77918
k__Bacteria|p__Actinobacteria|c__Actinobacteria|o__Actinomycetales    49.53809    44.96297    54.09146    48.77918
k__Bacteria|p__Actinobacteria|c__Actinobacteria|o__Actinomycetales|f__Cellulomonadaceae    0.08247    0.064    0.0    0.0
k__Bacteria|p__Actinobacteria|c__Actinobacteria|o__Actinomycetales|f__Cellulomonadaceae|g__Cellulomonas    0.08247    0.064    0.0    0.0
k__Bacteria|p__Actinobacteria|c__Actinobacteria|o__Actinomycetales|f__Cellulomonadaceae|g__Cellulomonas|s__Cellulomonas_unclassified    0.08247    0.064    0.0    0.0
绘制热图
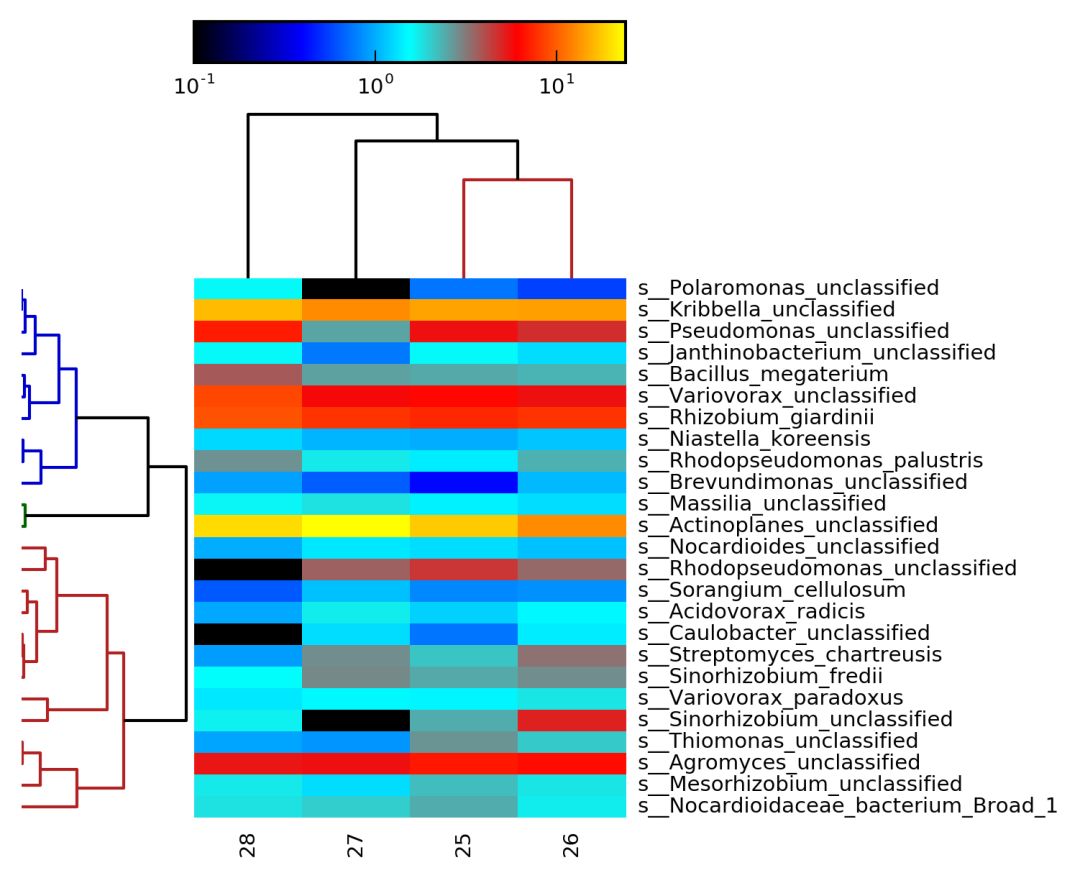
metaphlan_hclust_heatmap.py -c bbcry --top 25 --minv 0.1 -s log --in merged_metaphlan2.txt --out abundance_heatmap.pdf
metaphlan_hclust_heatmap.py -c bbcry --top 25 --minv 0.1 -s log --in merged_metaphlan2.txt --out abundance_heatmap.png
c设置颜色方案,top设置物种数量,minv最大相对丰度,s标准化方法,文件名结尾可先pdf/png/svg三种图片格式。更多说明详见 metaphlan_hclust_heatmap.py -h
按各样本丰度绘制热图,显示前25种高丰度菌种类,样品默认采用bray_curtis距离聚类,微生物采用相关性距离聚类;数值采用对数10进行变换
自定义数据库
基于bowtie2数据库重建标记序列
bowtie2-inspect ~/software/metaphlan2/databases/mpa_v20_m200 > markers.fa追求你获得的maker至数据库
cat new_marker.fa >> markers.fa
bowtie2-build markers.fa ~/software/metaphlan2/databases/mpa_v21_m200
并在python命令行中添加相应的物种注释信息,详见 https://bitbucket.org/biobakery/metaphlan2/overview#markdown-header-customizing-the-database
株水平群体基因组
此步配合StrainPhlAn软件,分析宏基因样本中菌株水平序列变异,输入序列样本,输出MSA多序列比对文件。StrainPhlAn采用RAxML构建进化树。
可以生成如下结果:
以HMP6个样本为例,分析粪拟杆菌Bacteroides caccae序列在株水平的变异
有需要有朋友可按如下教程安装相关软件并分析 https://bitbucket.org/biobakery/metaphlan2/overview#markdown-header-metagenomic-strain-level-population-genomics
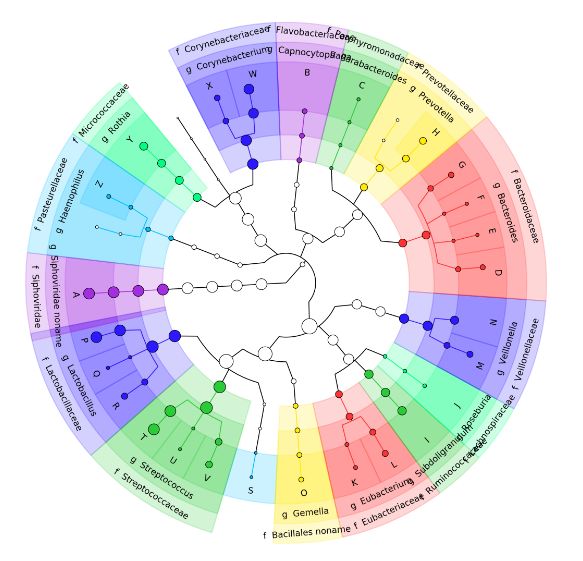
GraPhlAn图
需要安装好GraPhlan
# 基于丰度表生成graphlan文件
export2graphlan.py --skip_rows 1,2 -i merged_metaphlan2.txt --tree merged_abundance.tree.txt --annotation merged_abundance.annot.txt --most_abundant 100 --abundance_threshold 1 --least_biomarkers 10 --annotations 5,6 --external_annotations 7 --min_clade_size 1
# 绘图
graphlan_annotate.py --annot merged_abundance.annot.txt merged_abundance.tree.txt merged_abundance.xml
graphlan.py --dpi 300 merged_abundance.xml merged_abundance.png --external_legends
建议输出文件输出pdf,方便后期修改文字大小和内容
采用Graphlan展示物种组成
进一步学习
可参考metaphlan2官方教程
https://bitbucket.org/biobakery/biobakery/wiki/metaphlan2
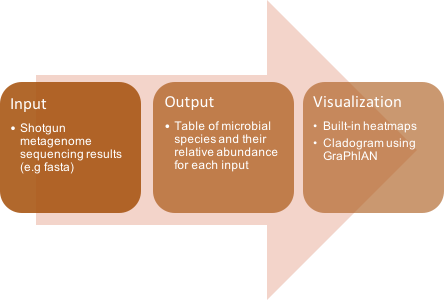
分析流程
参考文献
Duy Tin Truong, Eric Franzosa, Timothy L Tickle, Matthias Scholz, George Weingart, Edoardo Pasolli, Adrian Tett, Curtis Huttenhower, and Nicola Segata
MetaPhlAn2 for enhanced metagenomic taxonomic profiling
Nature Methods 12, 902–903 (2015)
