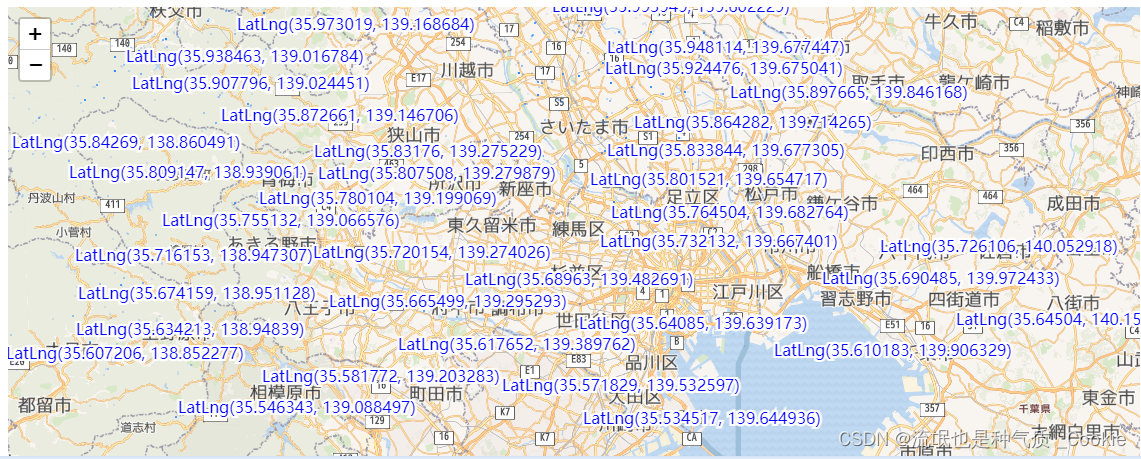
1.LabelTextCollision效果图:
const customPane = map.createPane("customPane");
        customPane.style.zIndex = 700;
        var labelTextCollision = new L.LabelTextCollision({
            collisionFlg: true,
            pane: customPane // 自定义pane但是会完全覆盖点位导致无法点击
        });


        var p = L.polyline(
            [[35.695786, 139.749213],
            [35.696786, 139.748213],
            [35.695786, 139.747213]], {
            weight: 12,
            color: '#ff0000',
            text: 'Leaflet.LabelTextCollision!!!!!!!!'
        }).addTo(map);

        map.options.renderer = labelTextCollision
        var layers = L.featureGroup().addTo(map);
        for (var index in data) {
            let marker = null
            var d = data[index];
            var latlng = L.latLng(d[0], d[1]);
            marker = L.marker([latlng.lat, latlng.lng])
            var c = L.circleMarker(latlng, {
                // radius: 5,
                radius: 1,
                opacity: 0,
                text: latlng.toString(),
            });
            layers.addLayer(c);
            if (index == 3000) {
                break;
            }
        }
        /*
        // L.canvas 绘制的线 若不加pane默认在overlay-pane中国
        var myRenderer = L.canvas({ padding: 0.5, pane: 'customPane' }).addTo(map)
          var line = L.polyline(data, { renderer: myRenderer })
          line.addTo(map) */
效果图:
插件 Leaflet.ChineseTmsProviders(中国底图底图)我代码中命名为china,放在leaflet.js 同级目录
L.TileLayer.ChinaProvider = L.TileLayer.extend({

    initialize: function(type, options) { // (type, Object)
        var providers = L.TileLayer.ChinaProvider.providers;

        var parts = type.split('.');

        var providerName = parts[0];
        var mapName = parts[1];
        var mapType = parts[2];

        var url = providers[providerName][mapName][mapType];
        options.subdomains = providers[providerName].Subdomains;

        L.TileLayer.prototype.initialize.call(this, url, options);
    }
});

L.TileLayer.ChinaProvider.providers = {
    TianDiTu: {
        Normal: {
            Map: "http://t{s}.tianditu.cn/DataServer?T=vec_w&X={x}&Y={y}&L={z}",
            Annotion: "http://t{s}.tianditu.cn/DataServer?T=cva_w&X={x}&Y={y}&L={z}"
        },
        Satellite: {
            Map: "http://t{s}.tianditu.cn/DataServer?T=img_w&X={x}&Y={y}&L={z}",
            Annotion: "http://t{s}.tianditu.cn/DataServer?T=cia_w&X={x}&Y={y}&L={z}"
        },
        Terrain: {
            Map: "http://t{s}.tianditu.cn/DataServer?T=ter_w&X={x}&Y={y}&L={z}",
            Annotion: "http://t{s}.tianditu.cn/DataServer?T=cta_w&X={x}&Y={y}&L={z}"
        },
        Subdomains: ['0', '1', '2', '3', '4', '5', '6', '7']
    },

    GaoDe: {
        Normal: {
            Map: 'http://webrd0{s}.is.autonavi.com/appmaptile?lang=zh_cn&size=1&scale=1&style=8&x={x}&y={y}&z={z}'
        },
        Satellite: {
            Map: 'http://webst0{s}.is.autonavi.com/appmaptile?style=6&x={x}&y={y}&z={z}',
            Annotion: 'http://webst0{s}.is.autonavi.com/appmaptile?style=8&x={x}&y={y}&z={z}'
        },
        Subdomains: ["1", "2", "3", "4"]
    },

    Google: {
        Normal: {
            Map: "http://www.google.cn/maps/vt?lyrs=m@189&gl=cn&x={x}&y={y}&z={z}"
        },
        Satellite: {
            Map: "http://www.google.cn/maps/vt?lyrs=s@189&gl=cn&x={x}&y={y}&z={z}"
        },
        Subdomains: []
    },

    Geoq: {
        Normal: {
            Map: "http://map.geoq.cn/ArcGIS/rest/services/ChinaOnlineCommunity/MapServer/tile/{z}/{y}/{x}",
            Color: "http://map.geoq.cn/ArcGIS/rest/services/ChinaOnlineStreetColor/MapServer/tile/{z}/{y}/{x}",
            PurplishBlue: "http://map.geoq.cn/ArcGIS/rest/services/ChinaOnlineStreetPurplishBlue/MapServer/tile/{z}/{y}/{x}",
            Gray: "http://map.geoq.cn/ArcGIS/rest/services/ChinaOnlineStreetGray/MapServer/tile/{z}/{y}/{x}",
            Warm: "http://map.geoq.cn/ArcGIS/rest/services/ChinaOnlineStreetWarm/MapServer/tile/{z}/{y}/{x}",
            Cold: "http://map.geoq.cn/ArcGIS/rest/services/ChinaOnlineStreetCold/MapServer/tile/{z}/{y}/{x}"
        },
        Subdomains: []

    }
};

L.tileLayer.chinaProvider = function(type, options) {
    return new L.TileLayer.ChinaProvider(type, options);
};
插件polylineDecorator.js,可自行下载
完整代码
<!DOCTYPE html>
<html lang="en">
<head>
  <meta charset="UTF-8">
  <meta http-equiv="X-UA-Compatible" content="IE=edge">
  <meta name="viewport" content="width=device-width, initial-scale=1.0">
  <title>Document</title>
  <link rel="stylesheet" href="./leaflet.css" />
  <script src="./leaflet.js"></script>
  <script src="./china.js"></script>
  <script src="./leaflet.polylineDecorator.js"></script>
</head>
<body>
<style>
#mapDiv { height: 300px; }

</style>
<div id="mapDiv"></div>
<script>
    //插件把 定义了多个国内的瓦片图层,我们只需要通过提供的方法访问到相应的图层即可
    //从插件代码可以看出 需要传入 providerName.mapName.mapType 从插件代码中查找所需要的值
    var test = L.tileLayer.chinaProvider('Geoq.Normal.Map', {
        maxZoom: 18,
        minZoom: 5
    });
    //此处可以定义多个图层,并可以再页面中进行选择
    var baseLayers = {"测试地图":test}

    var map = L.map("mapDiv", {
        center: [41.80, 123.43],
        zoom: 7,
        layers: [test],
        zoomControl: false
    });
    L.control.layers(baseLayers, null).addTo(map);
    L.control.zoom({
        zoomInTitle: '放大',
        zoomOutTitle: '缩小'
    }).addTo(map);

    // 插件使用polylineDecorator.js
    var arrow = L.polyline([[41.80, 123.43], [41.07, 123.00]], {opacity: 1,color: 'firebrick'}).bindPopup('I am red:').addTo(map);//
    var arrow2 = L.polyline([[41.80, 123.43], [40.13, 124.37]], {opacity: 1,color: 'lightgreen'}).bindPopup('I am green:').addTo(map);
    var arrow3 = L.polyline([[41.07, 123.00], [40.13, 124.37]], {opacity: 1,color: 'lightgreen'}).bindPopup('I am green:').addTo(map);

    var arrowHead = L.polylineDecorator(arrow, {
        patterns: [
        { offset: 0, repeat: 10, symbol: L.Symbol.dash({pixelSize: 5, pathOptions: {color: '#000', weight: 1, opacity: 0.2}}) },
        { offset: '16%', repeat: '33%', symbol: L.Symbol.marker({rotate: true, markerOptions: {
                    icon: L.icon({
                        iconUrl: './images/icon_plane.png',
                        iconAnchor: [16, 16]
                    })
                }})}
        ]
    }).addTo(map);

</script>
</body>
</html>插件大全:Plugins - Leaflet - a JavaScript library for interactive maps
1、常用地图切换加载(osm、google、baidu、gaode、tianditu.etc)
https://github.com/htoooth/Leaflet.ChineseTmsProviders
2、切片地图加载(wmts)(支持矢量切片)
https://github.com/mylen/leaflet.TileLayer.WMTS
3、wms地图服务加载
https://github.com/heigeo/leaflet.wms
4、视窗范围框定(只容许查看和编辑给定范围地图)
https://github.com/aparshin/leaflet-boundary-canvas
5、地图要素显示比例尺控制(不同比例尺要素渲染)(根据屏幕坐标控制)(非常重要,常用)
https://github.com/GreenInfo-Network/L.TileLayer.PixelFilter/
6、卷帘对比(卷积运算)(历史对比)(非常重要)
https://github.com/digidem/leaflet-side-by-side
7、webGL地图要素渲染(适用于三维要素绘制)(非常重要)
https://gitlab.com/IvanSanchez/Leaflet.TileLayer.GL
8、快速重新渲染地图要素,动态修改地图样式(适用于矢量切片)(不用二次发布服务)(很实用)
(颜色获取) https://github.com/frogcat/leaflet-tilelayer-colorpicker
(样式调整)https://github.com/hnrchrdl/leaflet-tilelayer-colorizr
9、快速获取要素范围和属性信息(tootip方式)
https://github.com/consbio/Leaflet.UTFGrid
10、缓冲区(不推荐,存在bug,推荐使用geotools api后台生成缓冲区,需要坐标转换)
https://github.com/TolonUK/Leaflet.EdgeBuffer https://github.com/skeate/Leaflet.buffer
11、要素图层组加载过程数据获取(支持FeatureGroup loading和load事件)
https://github.com/Outdooractive/Leaflet.FeatureGroup.LoadEvents
12、地图要素移除,动态重新渲染底图(动画效果,缓冲效果)
https://gitlab.com/IvanSanchez/Leaflet.GridLayer.FadeOut
13、地图矢量切片服务加载和渲染(非常重要)
https://github.com/Leaflet/Leaflet.VectorGrid
(mapbox切片渲染)https://github.com/SpatialServer/Leaflet.MapboxVectorTile
(geojson格式渲染)https://github.com/mapbox/geojson-vt
14、常用格式地理数据加载(WKT、GeoJSON、KML、GPX、CSV、MDB、Shp等)
https://github.com/mapbox/leaflet-omnivore
https://github.com/makinacorpus/Leaflet.FileLayer
https://github.com/calvinmetcalf/leaflet.shapefile
15、地图WFS服务操作,数据增删改查(Inert、Update、Delete、Query、Transaction)(重中之重,WFS服务封装,结合oracle或者postgis数据库,arcgis server或者geoserver后台服务搭建)
https://github.com/Flexberry/Leaflet-WFST
存在bug,需要修改,已在github issues中为作者留言,希望尽快解决;
如果geoserver搭建服务端:
typeNS表示工作区间, typeName表示图层名称(表名一致)
16、自定义label标签(Marker,polygon)
https://github.com/Leaflet/Leaflet.label
17、自定义marker
https://github.com/marslan390/BeautifyMarker
18、聚合数据
https://github.com/Leaflet/Leaflet.markercluster
https://github.com/MazeMap/Leaflet.LayerGroup.Collision
https://github.com/SINTEF-9012/PruneCluster
19、热力图
https://github.com/Leaflet/Leaflet.heat
http://ursudio.com/webgl-heatmap-leaflet/
20、加载echarts图(聚合图、迁徙图、热力图)(非常实用)
https://github.com/wandergis/leaflet-echarts.git
21、要素编辑(面合并、分割、创建要素等)(结合leaflet.wfst)(非常实用)
https://github.com/Leaflet/Leaflet.toolbar
https://github.com/Leaflet/Leaflet.draw
https://github.com/Leaflet/Leaflet.Editable
https://github.com/codeofsumit/leaflet.pm
https://github.com/willfarrell/Leaflet.Clipper
22、图层切换,要素显示隐藏
https://github.com/ismyrnow/leaflet-groupedlayercontrol
23、地图导航条、全屏控件
https://github.com/turbo87/sidebar-v2/
https://github.com/kartena/Leaflet.Pancontrol
https://github.com/kartena/Leaflet.zoomslider
https://github.com/Leaflet/Leaflet.fullscreen
https://github.com/brunob/leaflet.fullscreen
24、鹰眼图
https://github.com/Norkart/Leaflet-MiniMap
25、测量控件
https://github.com/ljagis/leaflet-measure
26、控件按钮样式设置
https://github.com/CliffCloud/Leaflet.EasyButton
https://github.com/aratcliffe/Leaflet.contextmenu
27、地图打印插件
https://github.com/rowanwins/leaflet-easyPrint
https://github.com/Igor-Vladyka/leaflet.browser.print
28、定位当前位置
https://github.com/domoritz/leaflet-locatecontrol
29、坐标转换插件(与缓冲区、测量配合使用)(非常实用)
https://github.com/kartena/Proj4Leaflet
30、空间位置分析(非常实用)
(点是否在面内)https://github.com/kartena/Proj4Leaflet
(计算面积、距离)https://github.com/makinacorpus/Leaflet.GeometryUtil/blob/master/src/leaflet.geometryutil.js
31、路径分析(纠偏,地图匹配算法)
https://github.com/perliedman/leaflet-routing-machine
https://github.com/Project-OSRM/osrm-frontend
32、poi模糊查询
https://github.com/smeijer/leaflet-geosearch
https://github.com/perliedman/leaflet-control-geocoder
33、等势线、等势面
https://github.com/timwis/leaflet-choropleth

