二 折线图(line)
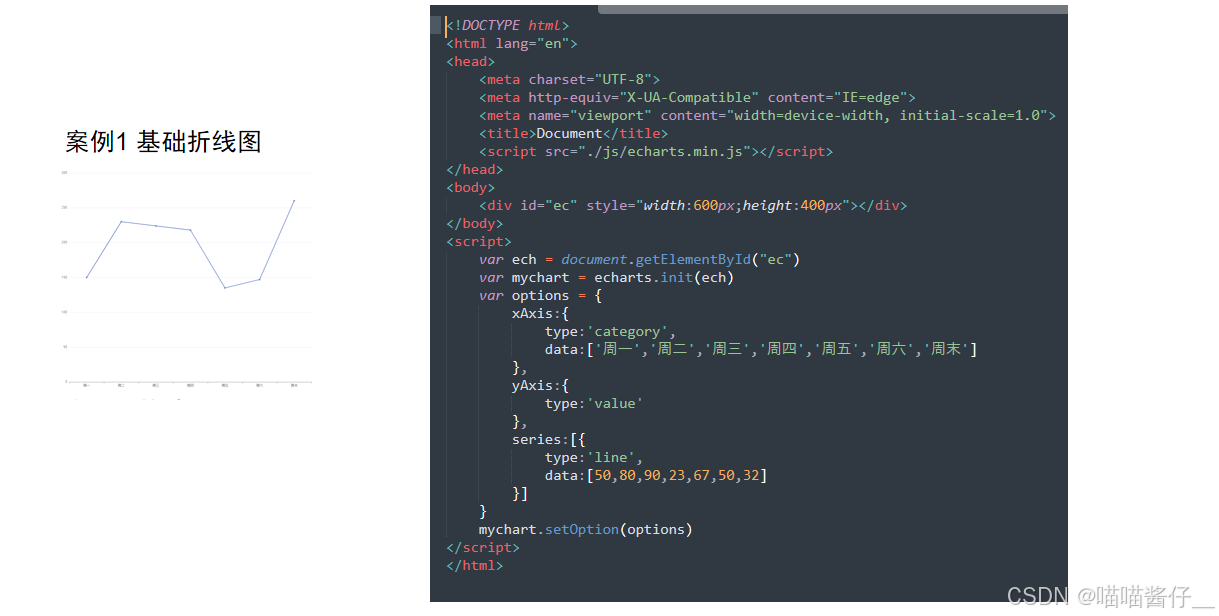
2.1 基础折线图
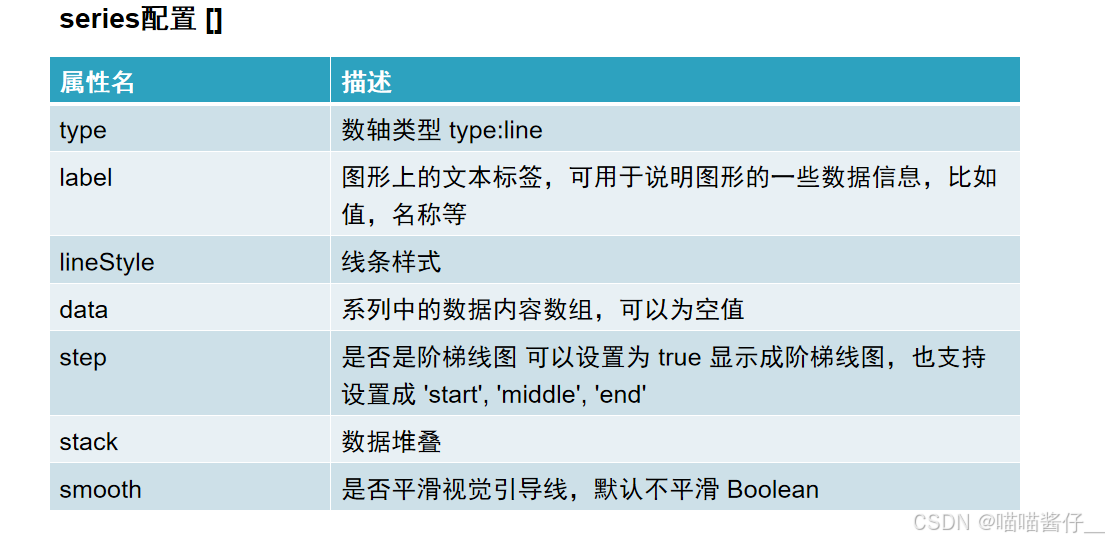
- s e ries 中的type设置为【t ype:line 】
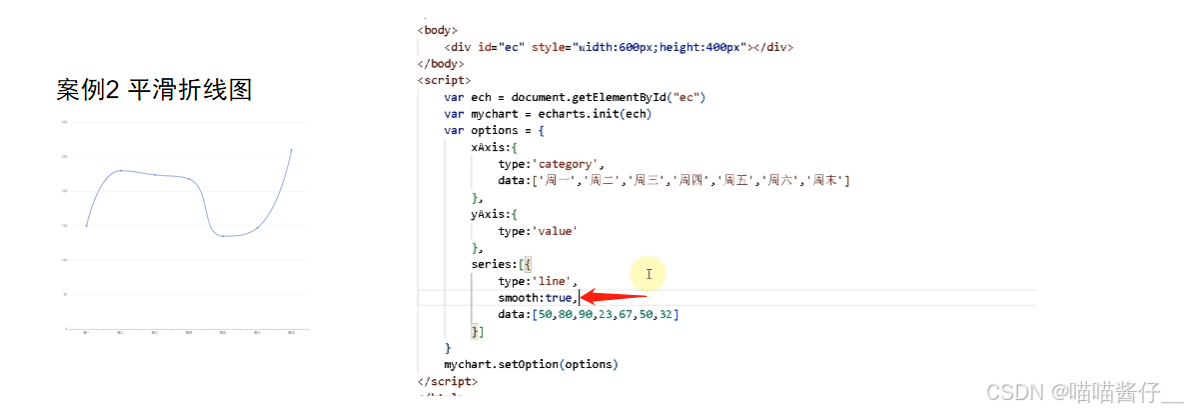
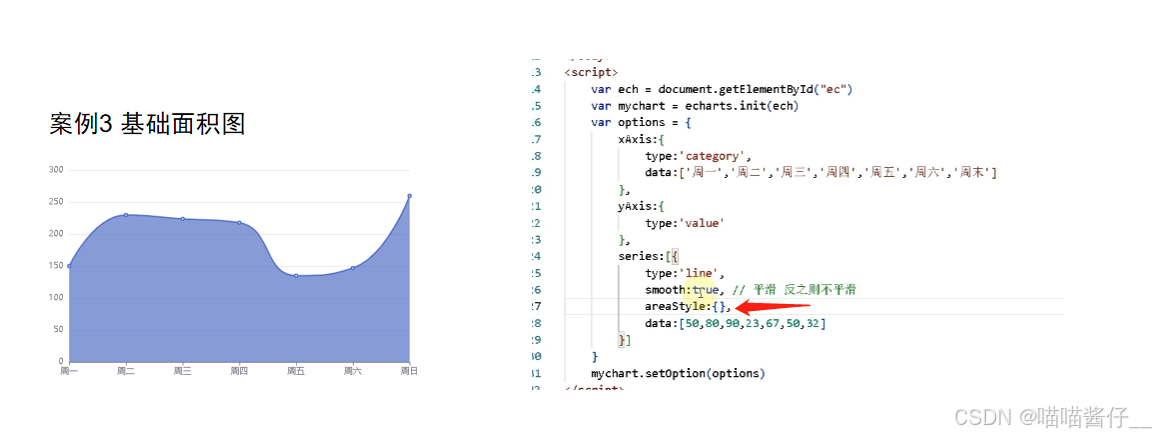
2.2 平滑折线图
- 添加一个属性: smooth:true, // 平滑 反之则不平滑
2.3 基础面积图
- 添加一个属性: areaStyle:{},
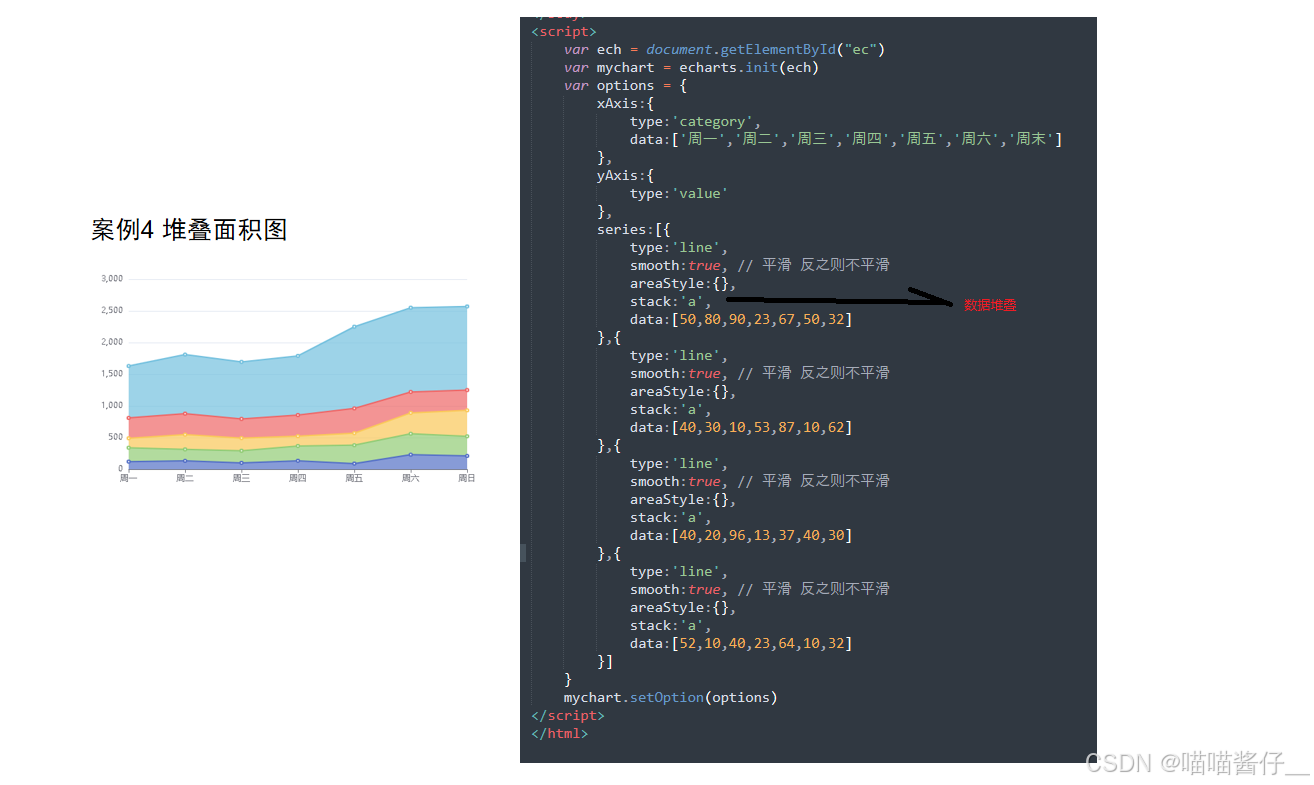
2.4 堆叠面积图
- 在每一个对象中 添加一个属性: stack:’
求第二个的大小: 第二个值- 第一个值
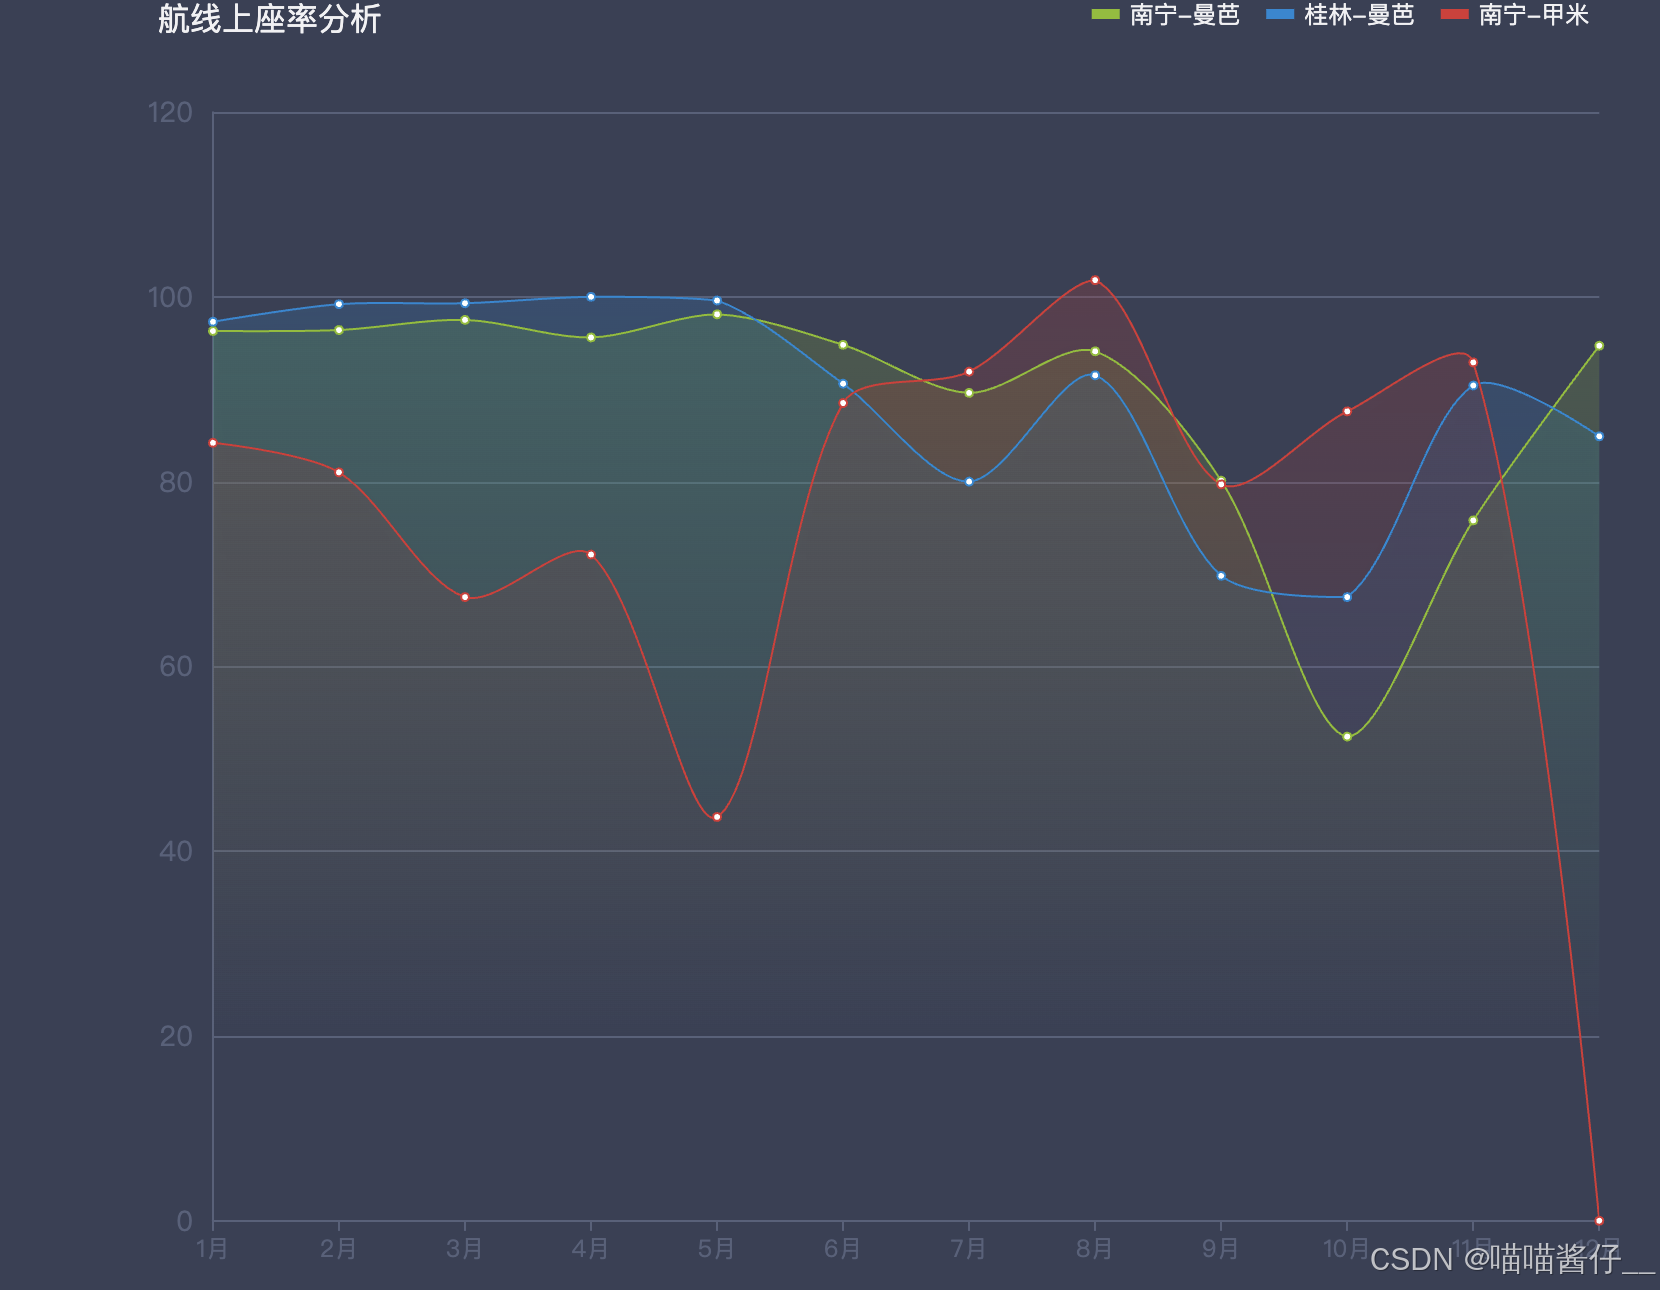
2.4.1 案例
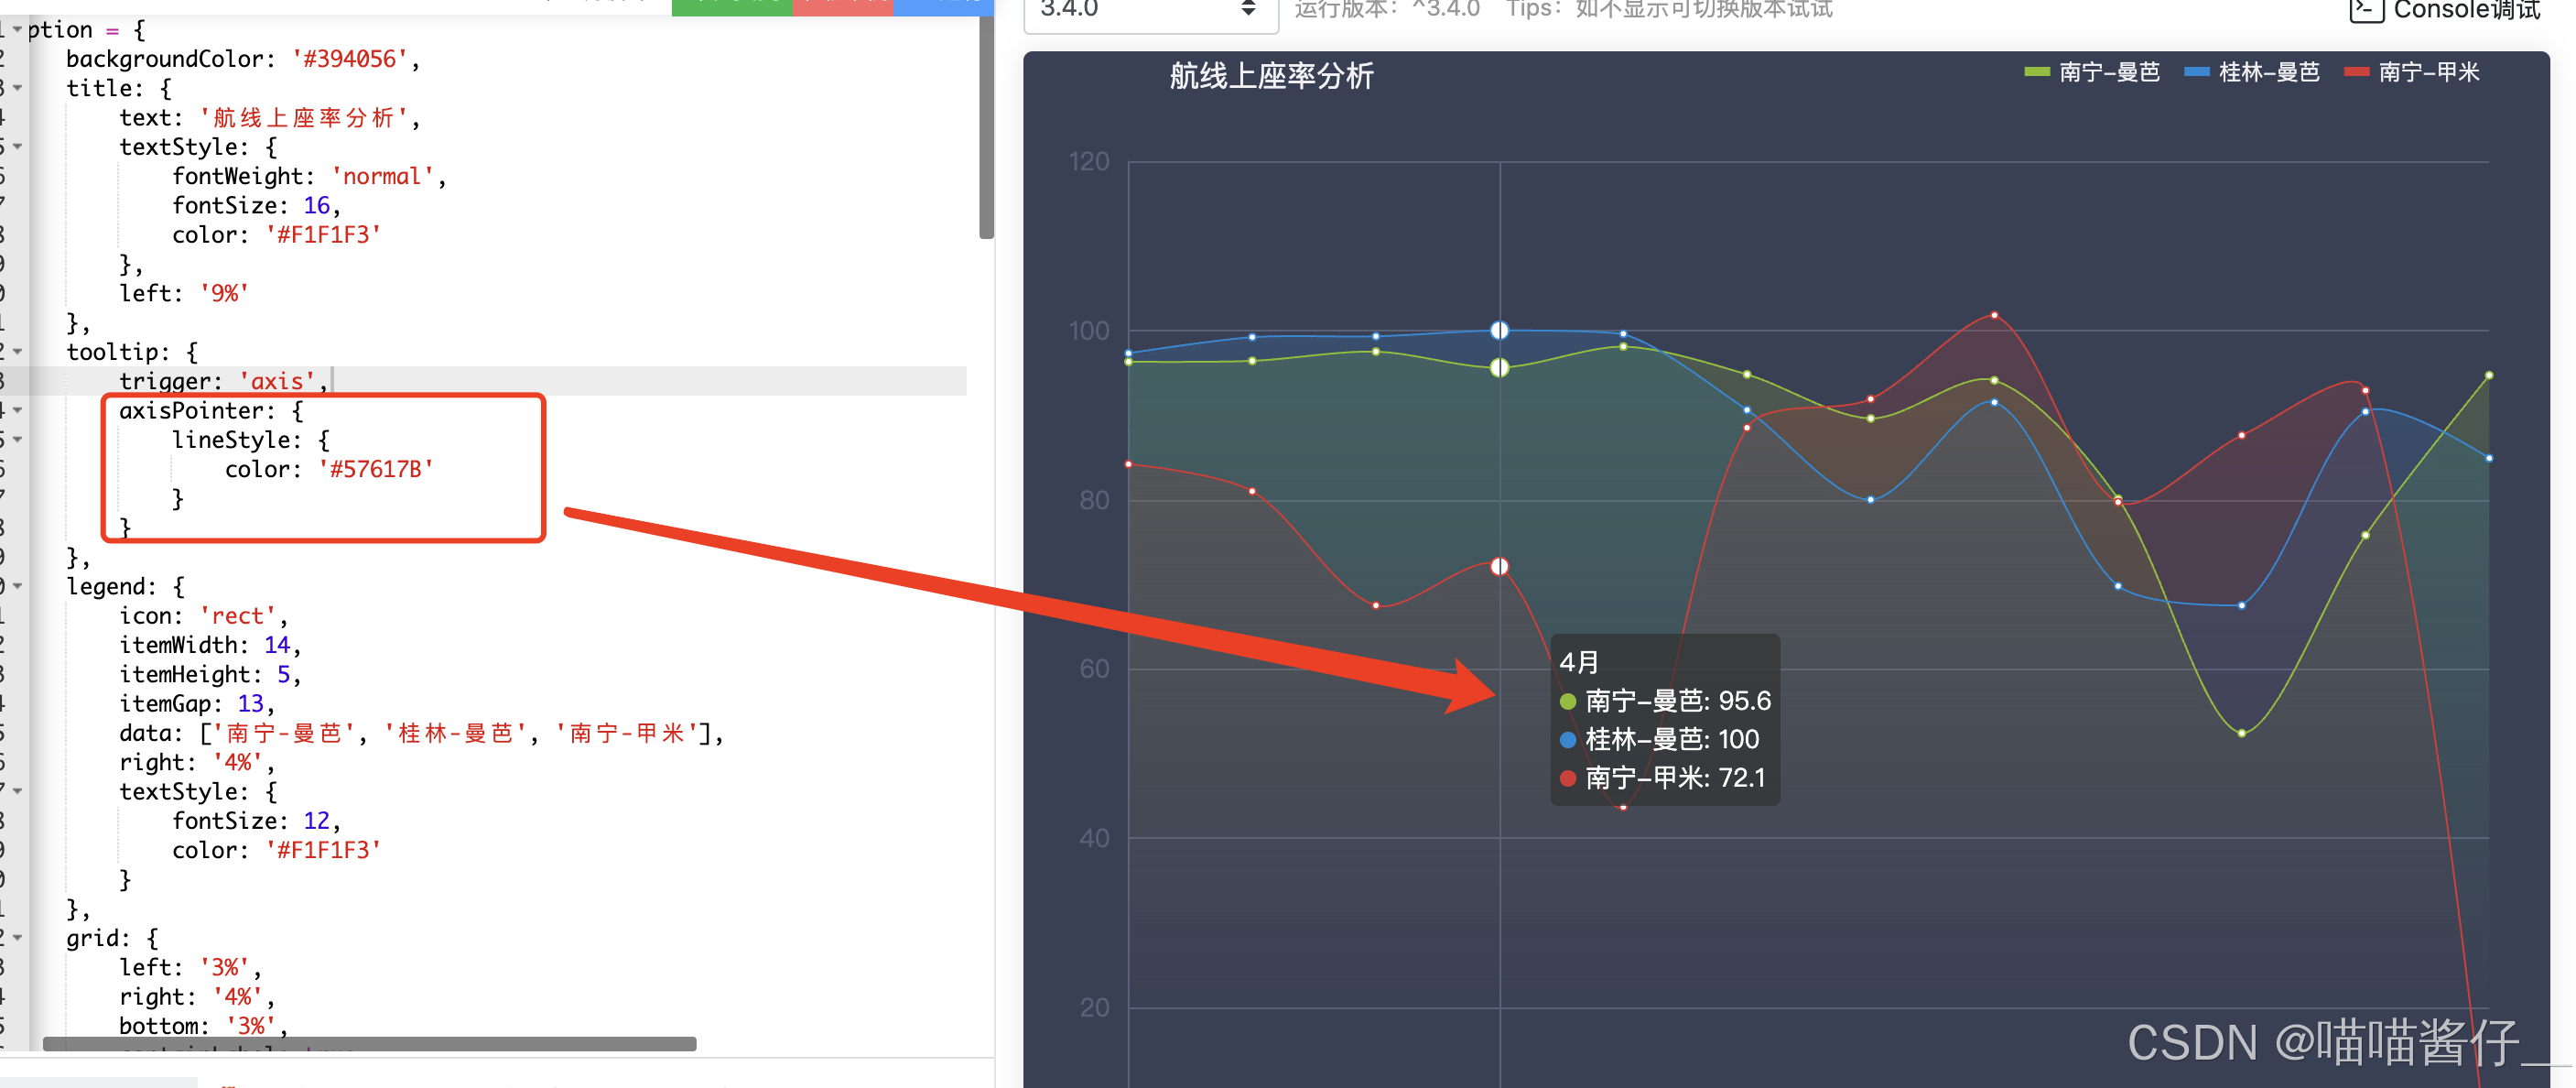
1tooltip. axisPointer
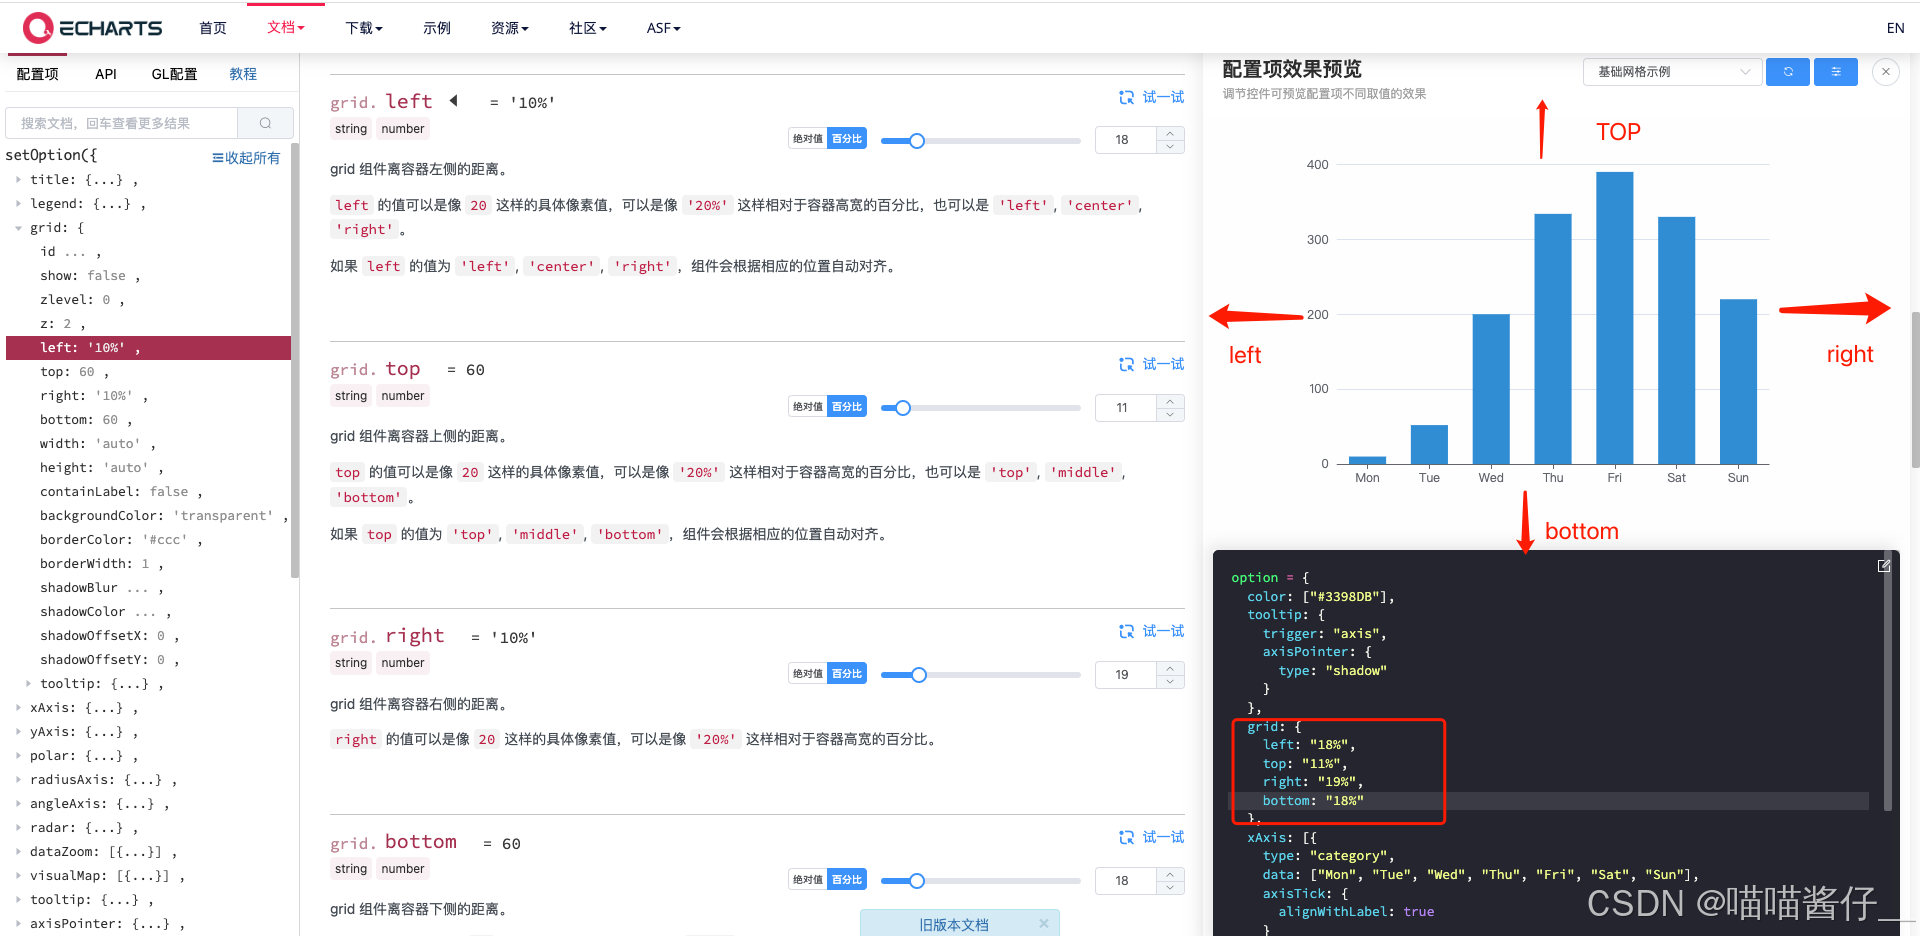
2 grid
grid 区域是否包含坐标轴的刻度标签。
containLabel 为 false 的时候:
grid.left grid.right grid.top grid.bottom grid.width grid.height 决定的是由坐标轴形成的矩形的尺寸和位置。
这比较适用于多个 grid 进行对齐的场景,因为往往多个 grid 对齐的时候,是依据坐标轴来对齐的。
containLabel 为 true 的时候:
grid.left grid.right grid.top grid.bottom grid.width grid.height 决定的是包括了坐标轴标签在内的所有内容所形成的矩形的位置。
这常用于『防止标签溢出』的场景,标签溢出指的是,标签长度动态变化时,可能会溢出容器或者覆盖其他组件。
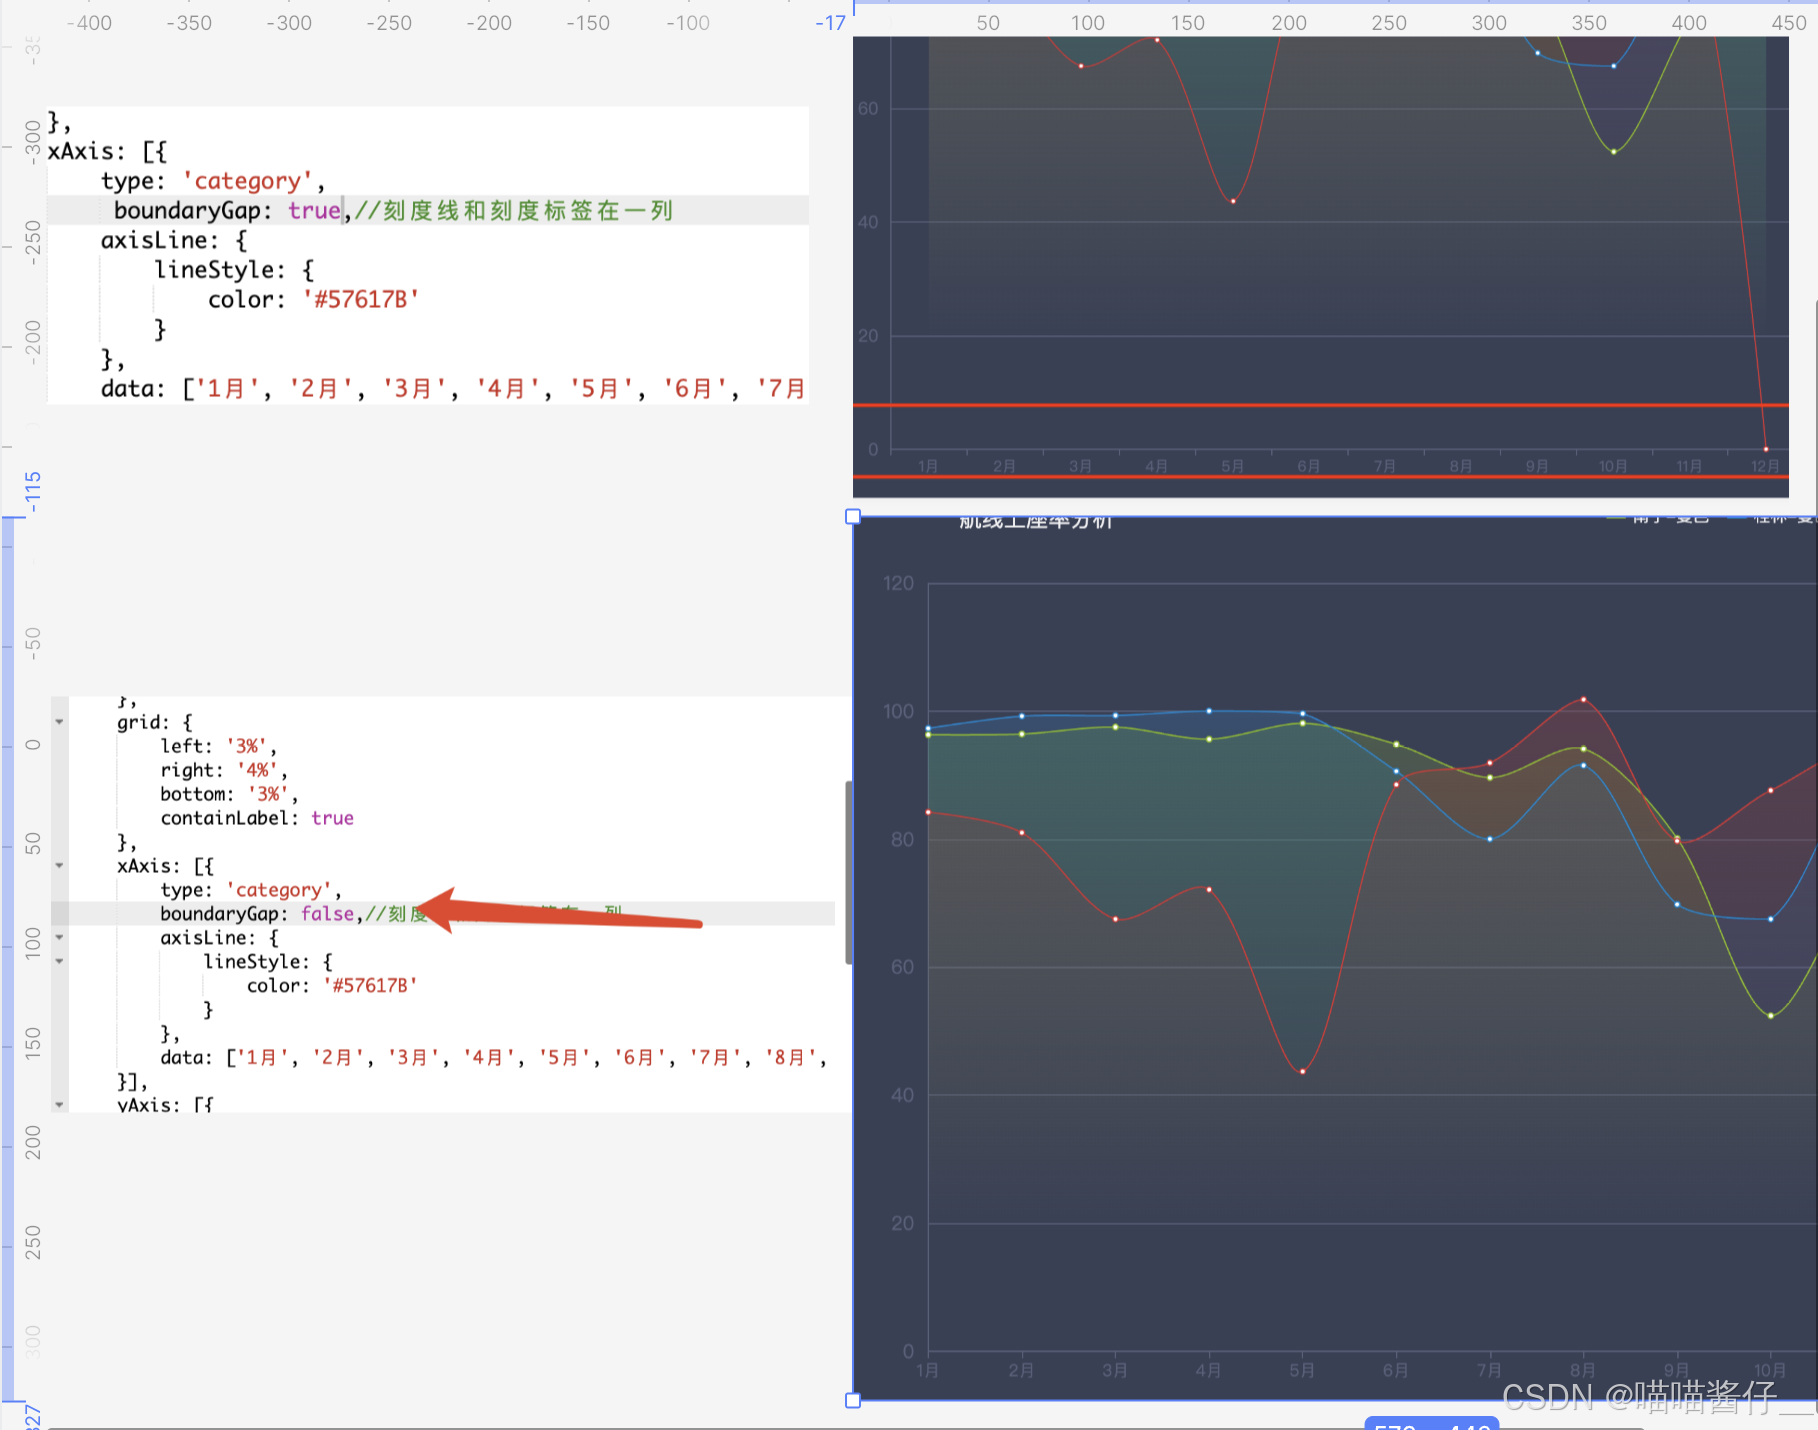
3说明:x坐标轴两边留白策略,类目轴和非类目轴的设置和表现不一样。
3 xAxis.axisLine. lineStyle
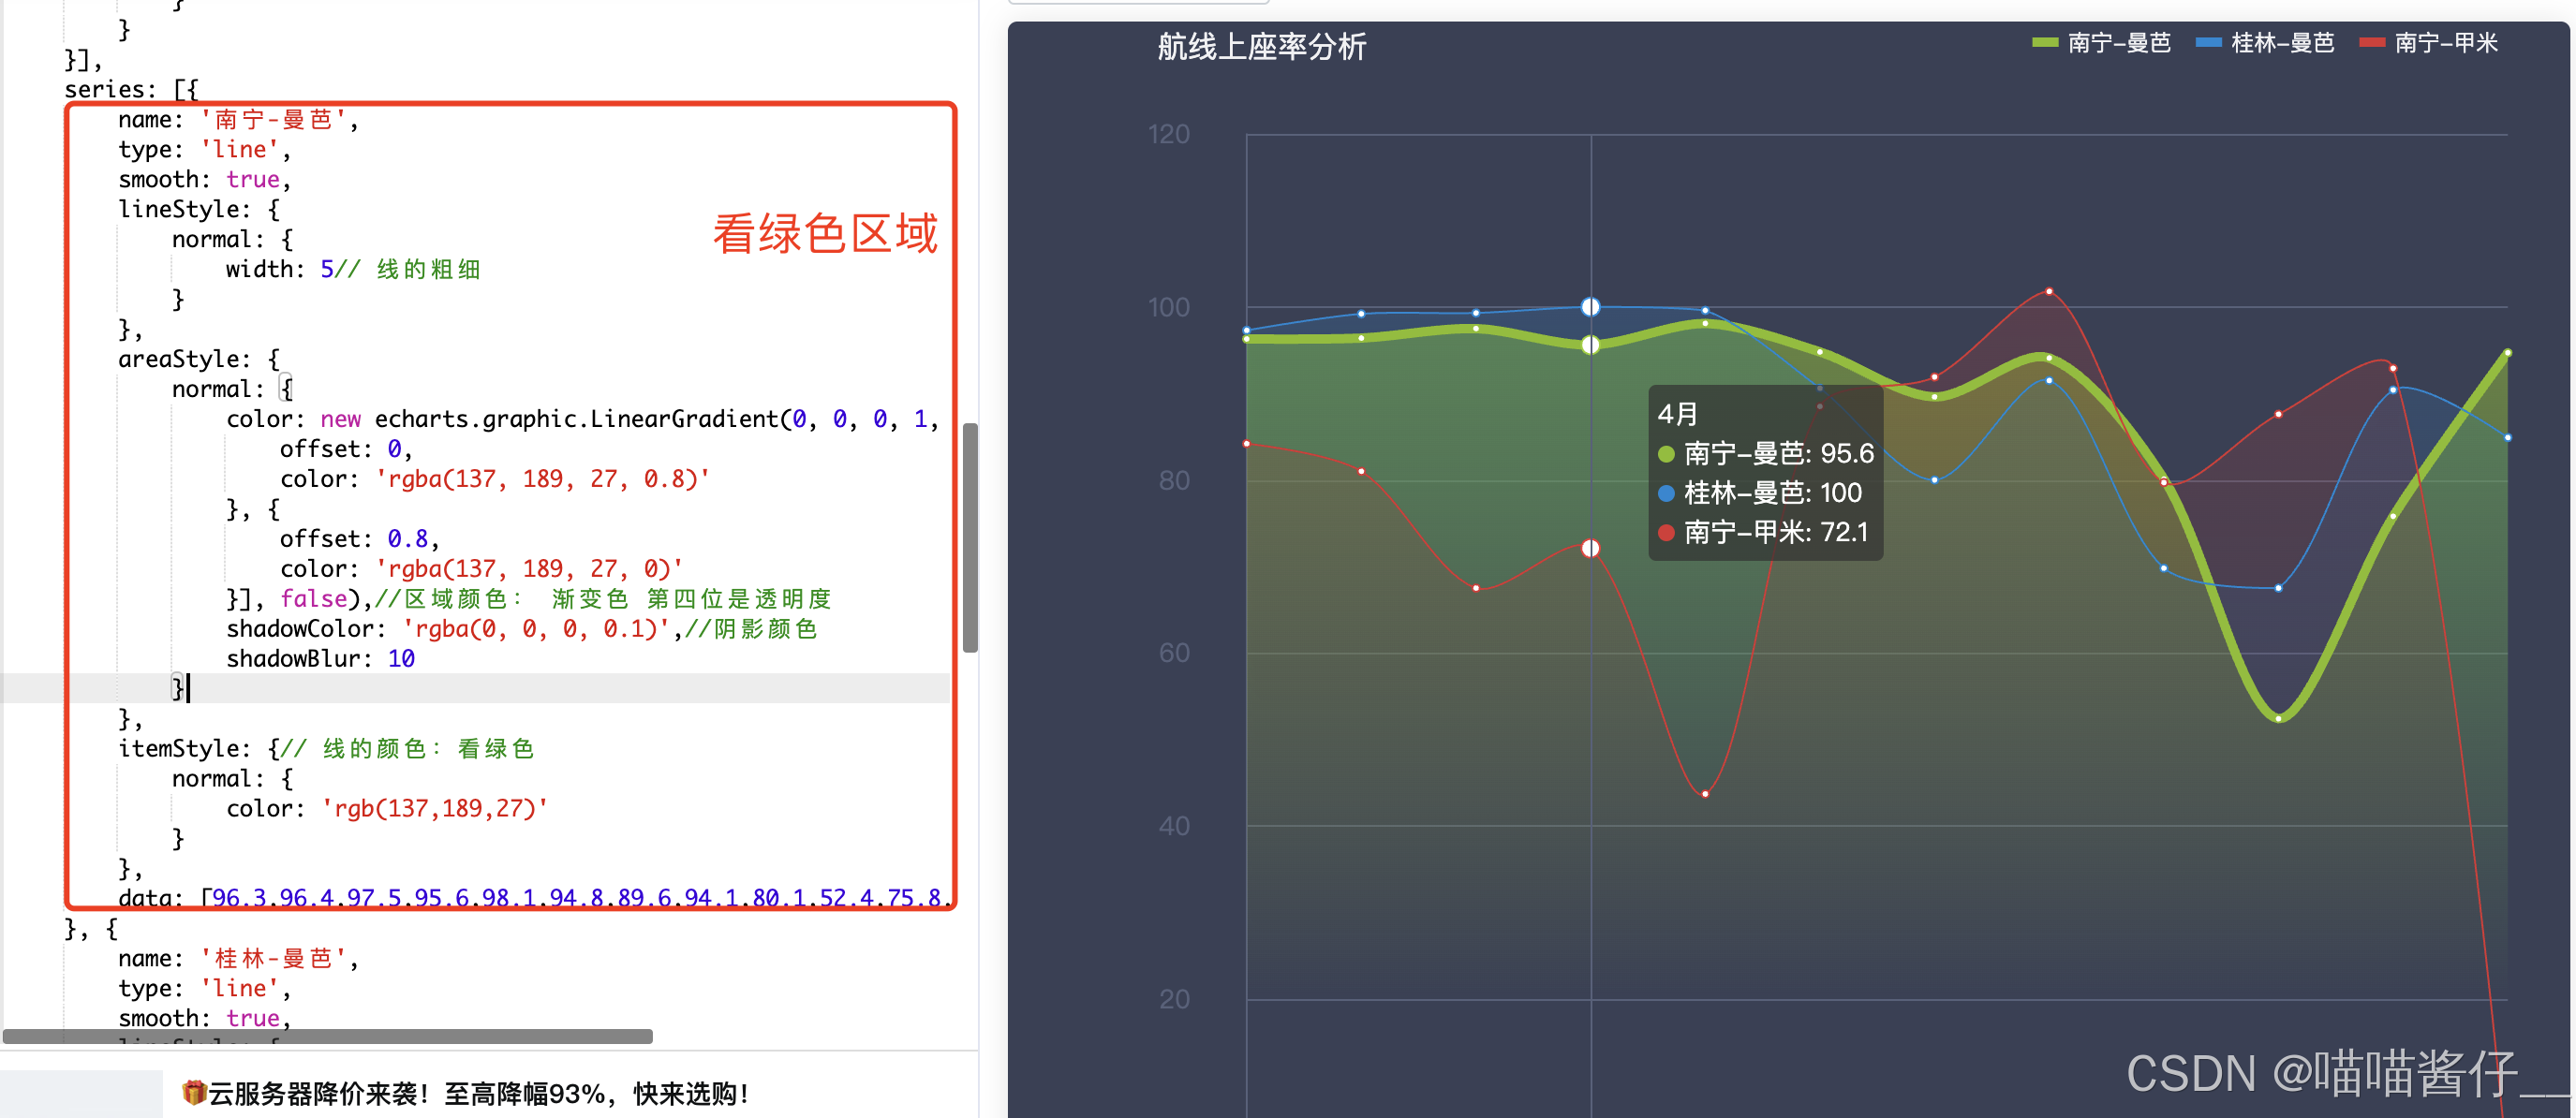
4 areaStyle 区域面积
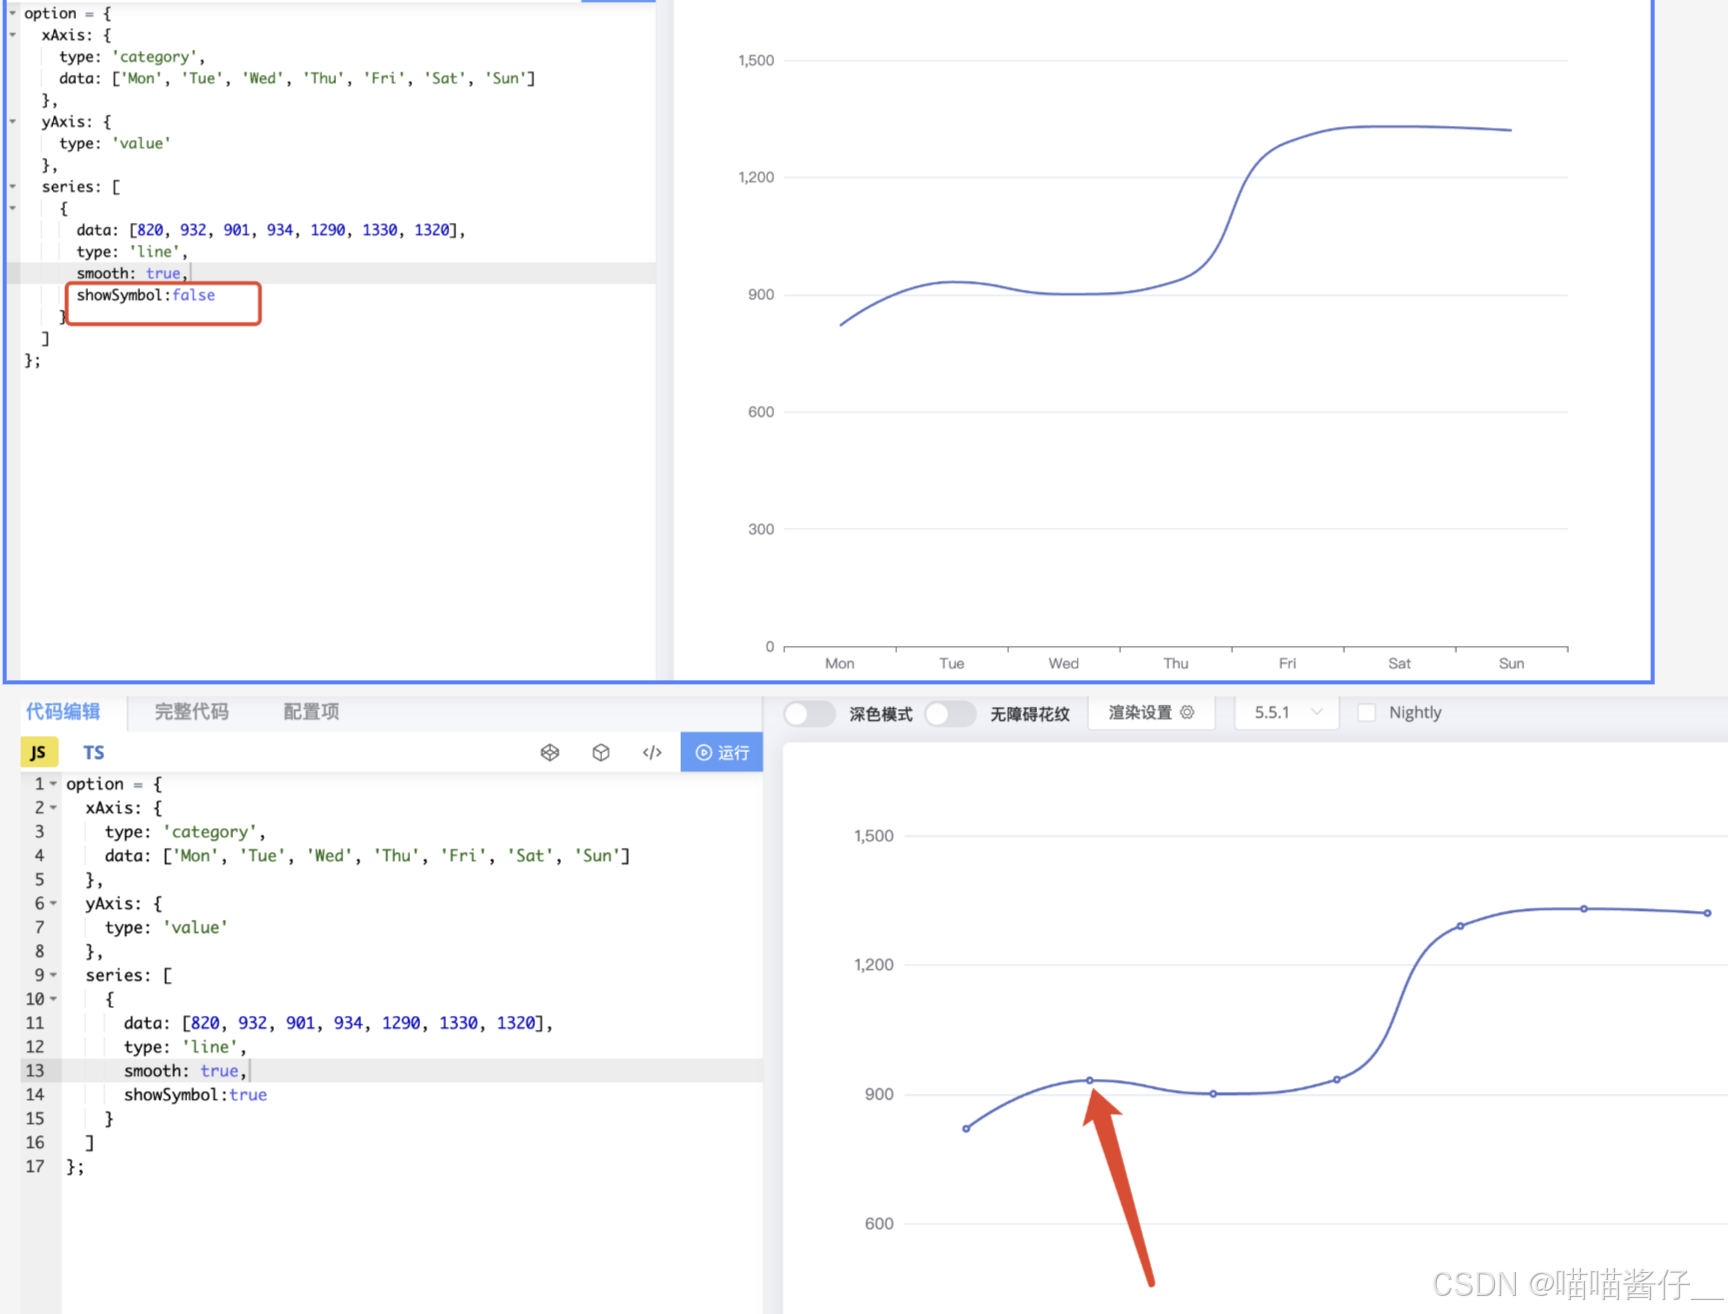
5 showSymbol: false,
是否显示 symbol, 如果 false 则只有在 tooltip hover 的时候显示。
6 代码
option = {
    backgroundColor: '#394056',
    title: {
        text: '航线上座率分析',
        textStyle: {
            fontWeight: 'normal',
            fontSize: 16,
            color: '#F1F1F3'
        },
        left: '9%'
    },
    tooltip: {
        trigger: 'axis',//柱状图,折线图等会使用类目轴的图表中使用
        axisPointer: {// 坐标轴指示器
            lineStyle: {
                color: '#57617B'
            }
        }
    },
    legend: {
        icon: 'rect',//长方形:可以是圆,椭圆,图片等。。。
        itemWidth: 14,//图标宽
        itemHeight: 5,
        itemGap: 13,//图例每项之间的间隔。
        data: ['南宁-曼芭', '桂林-曼芭', '南宁-甲米'],
        right: '4%',
        textStyle: {//文字颜色
            fontSize: 12,
            color: '#F1F1F3'
        }
    },
    grid: {
        left: '9%',
        right: '4%',
        bottom: '3%',
        containLabel: true
    },
    xAxis: [{
        type: 'category',
         boundaryGap: false,
        axisLine: {
            lineStyle: {
                color: '#57617B'
            }
        },
        data: ['1月', '2月', '3月', '4月', '5月', '6月', '7月', '8月', '9月', '10月', '11月', '12月']
    }],
    yAxis: [{
        type: 'value',
        axisTick: {
            show: false
        },
        axisLine: {
            lineStyle: {
                color: '#57617B'
            }
        },
        axisLabel: {
            margin: 30,
            textStyle: {
                fontSize: 14
            }
        },
        splitLine: {
            lineStyle: {
                color: '#57617B'
            }
        }
    }],
    series: [{
        name: '南宁-曼芭',
        type: 'line',
        smooth: true,
        lineStyle: {
            normal: {
                width: 5// 线的粗细
            }
        },
        areaStyle: {
            normal: {
                color: new echarts.graphic.LinearGradient(0, 0, 0, 1, [{
                    offset: 0,
                    color: 'rgba(137, 189, 27, 0.8)'
                }, {
                    offset: 0.8,
                    color: 'rgba(137, 189, 27, 0)'
                }], false),//区域颜色: 渐变色 第四位是透明度
                shadowColor: 'rgba(0, 0, 0, 0.1)',//阴影颜色
                shadowBlur: 10
            }
        },
        itemStyle: {// 线的颜色:看绿色
            normal: {
                color: 'rgb(137,189,27)'
            }
        },
        data: [96.3,96.4,97.5,95.6,98.1,94.8,89.6,94.1,80.1,52.4,75.8,94.7]
    }, {
        name: '桂林-曼芭',
        type: 'line',
        smooth: true,
        lineStyle: {
            normal: {
                width: 1
            }
        },
        areaStyle: {
            normal: {
                color: new echarts.graphic.LinearGradient(0, 0, 0, 1, [{
                    offset: 0,
                    color: 'rgba(0, 136, 212, 0.3)'
                }, {
                    offset: 0.8,
                    color: 'rgba(0, 136, 212, 0)'
                }], false),
                shadowColor: 'rgba(0, 0, 0, 0.1)',
                shadowBlur: 10
            }
        },
        itemStyle: {
            normal: {
                color: 'rgb(0,136,212)'
            }
        },
        data: [97.3,99.2,99.3,100.0,99.6,90.6,80.0,91.5,69.8,67.5,90.4,84.9]
    }, {
        name: '南宁-甲米',
        type: 'line',
        smooth: true,
        lineStyle: {
            normal: {
                width: 1
            }
        },
        areaStyle: {
            normal: {
                color: new echarts.graphic.LinearGradient(0, 0, 0, 1, [{
                    offset: 0,
                    color: 'rgba(219, 50, 51, 0.3)'
                }, {
                    offset: 0.8,
                    color: 'rgba(219, 50, 51, 0)'
                }], false),
                shadowColor: 'rgba(0, 0, 0, 0.1)',
                shadowBlur: 10
            }
        },
        itemStyle: {
            normal: {
                color: 'rgb(219,50,51)'
            }
        },
        data: [84.2,81.0,67.5,72.1,43.7,88.5,91.9,101.8,79.7,87.6,92.9,0]
    }, ]
};
2.5 案例
看图找点:
-
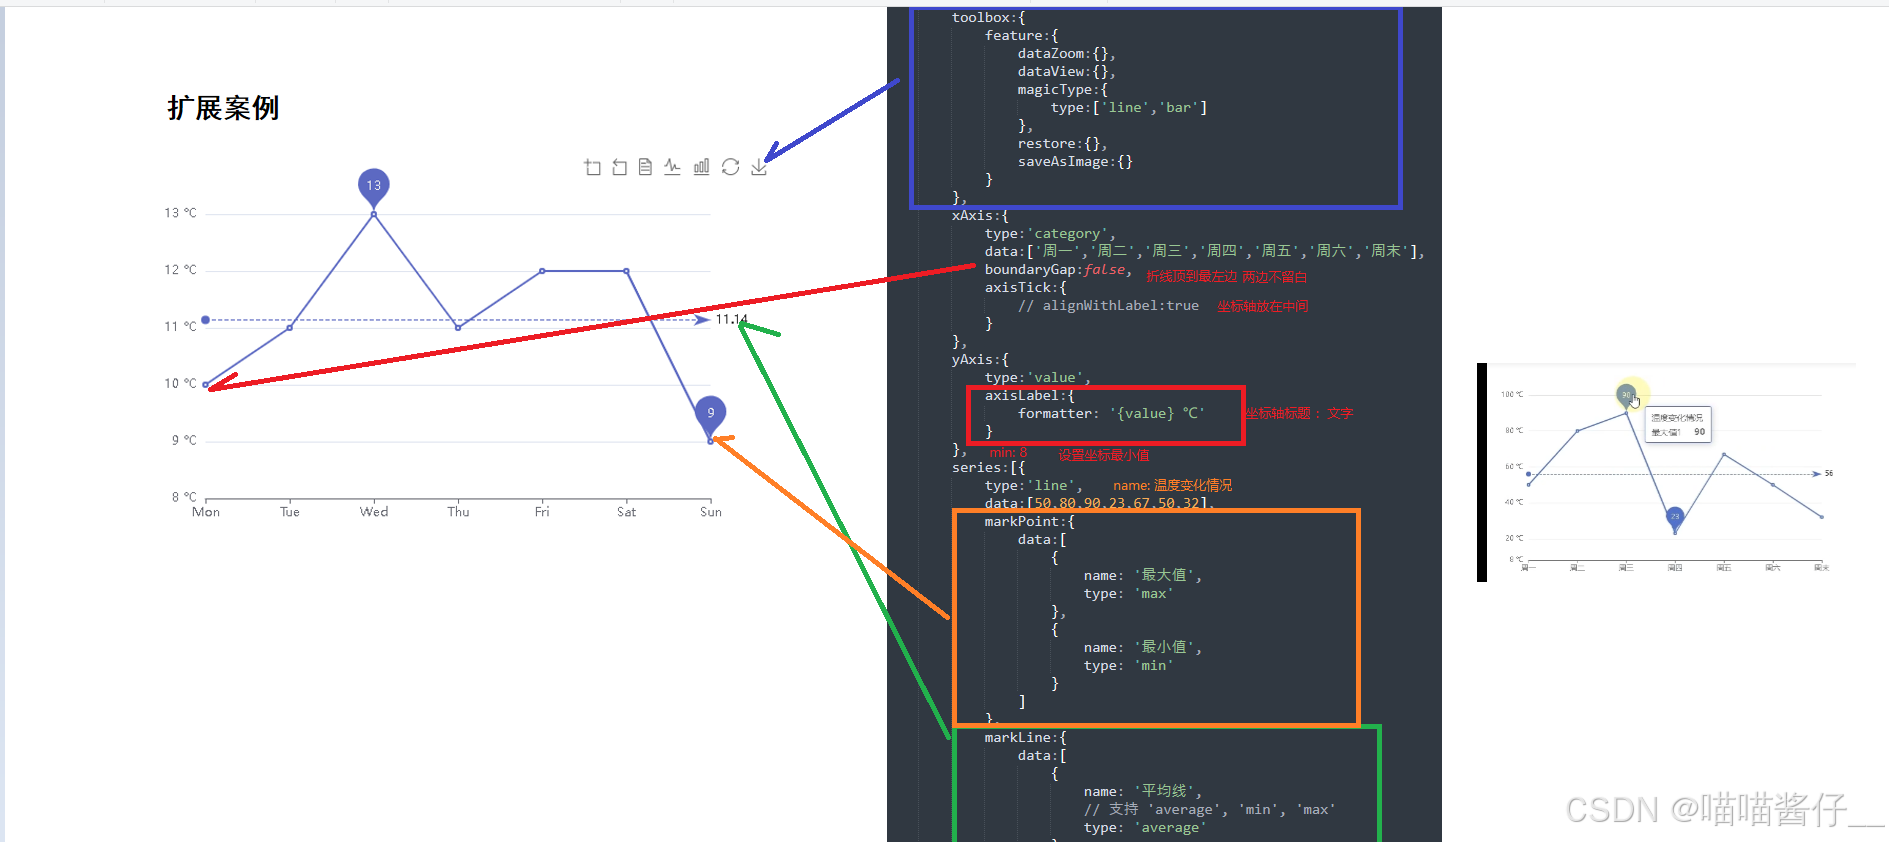
12 摄氏度 (格式化文字): label里边使用for ma to r
-
y轴起点不是0 : min: 8
-
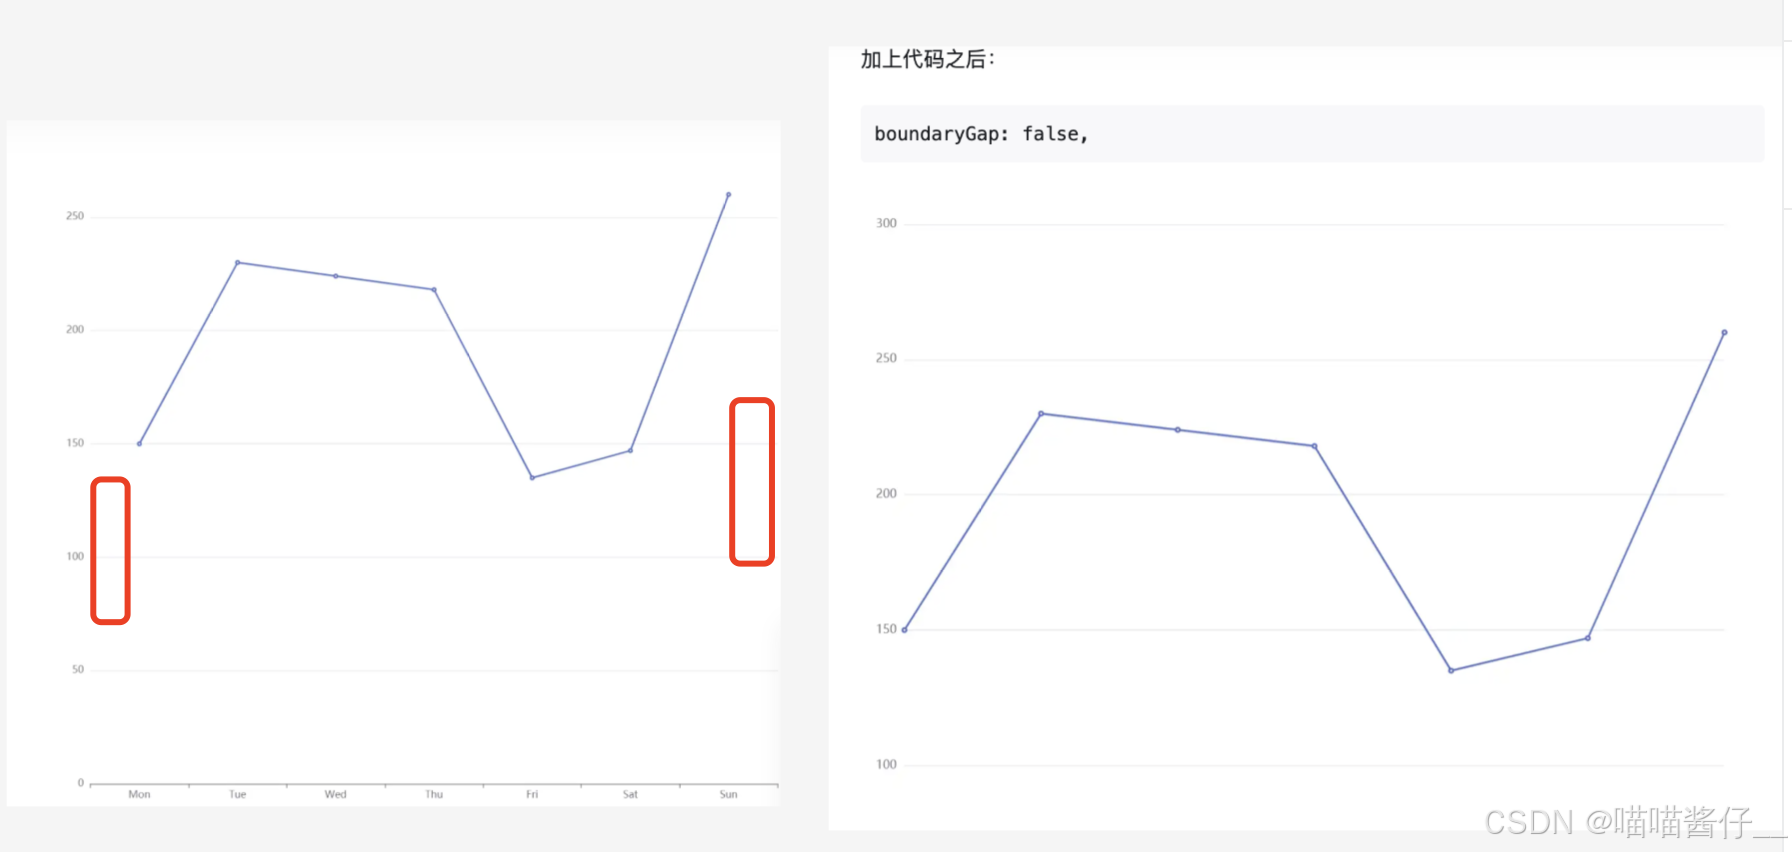
折线和刻度顶到头: boundaryGap:false
-
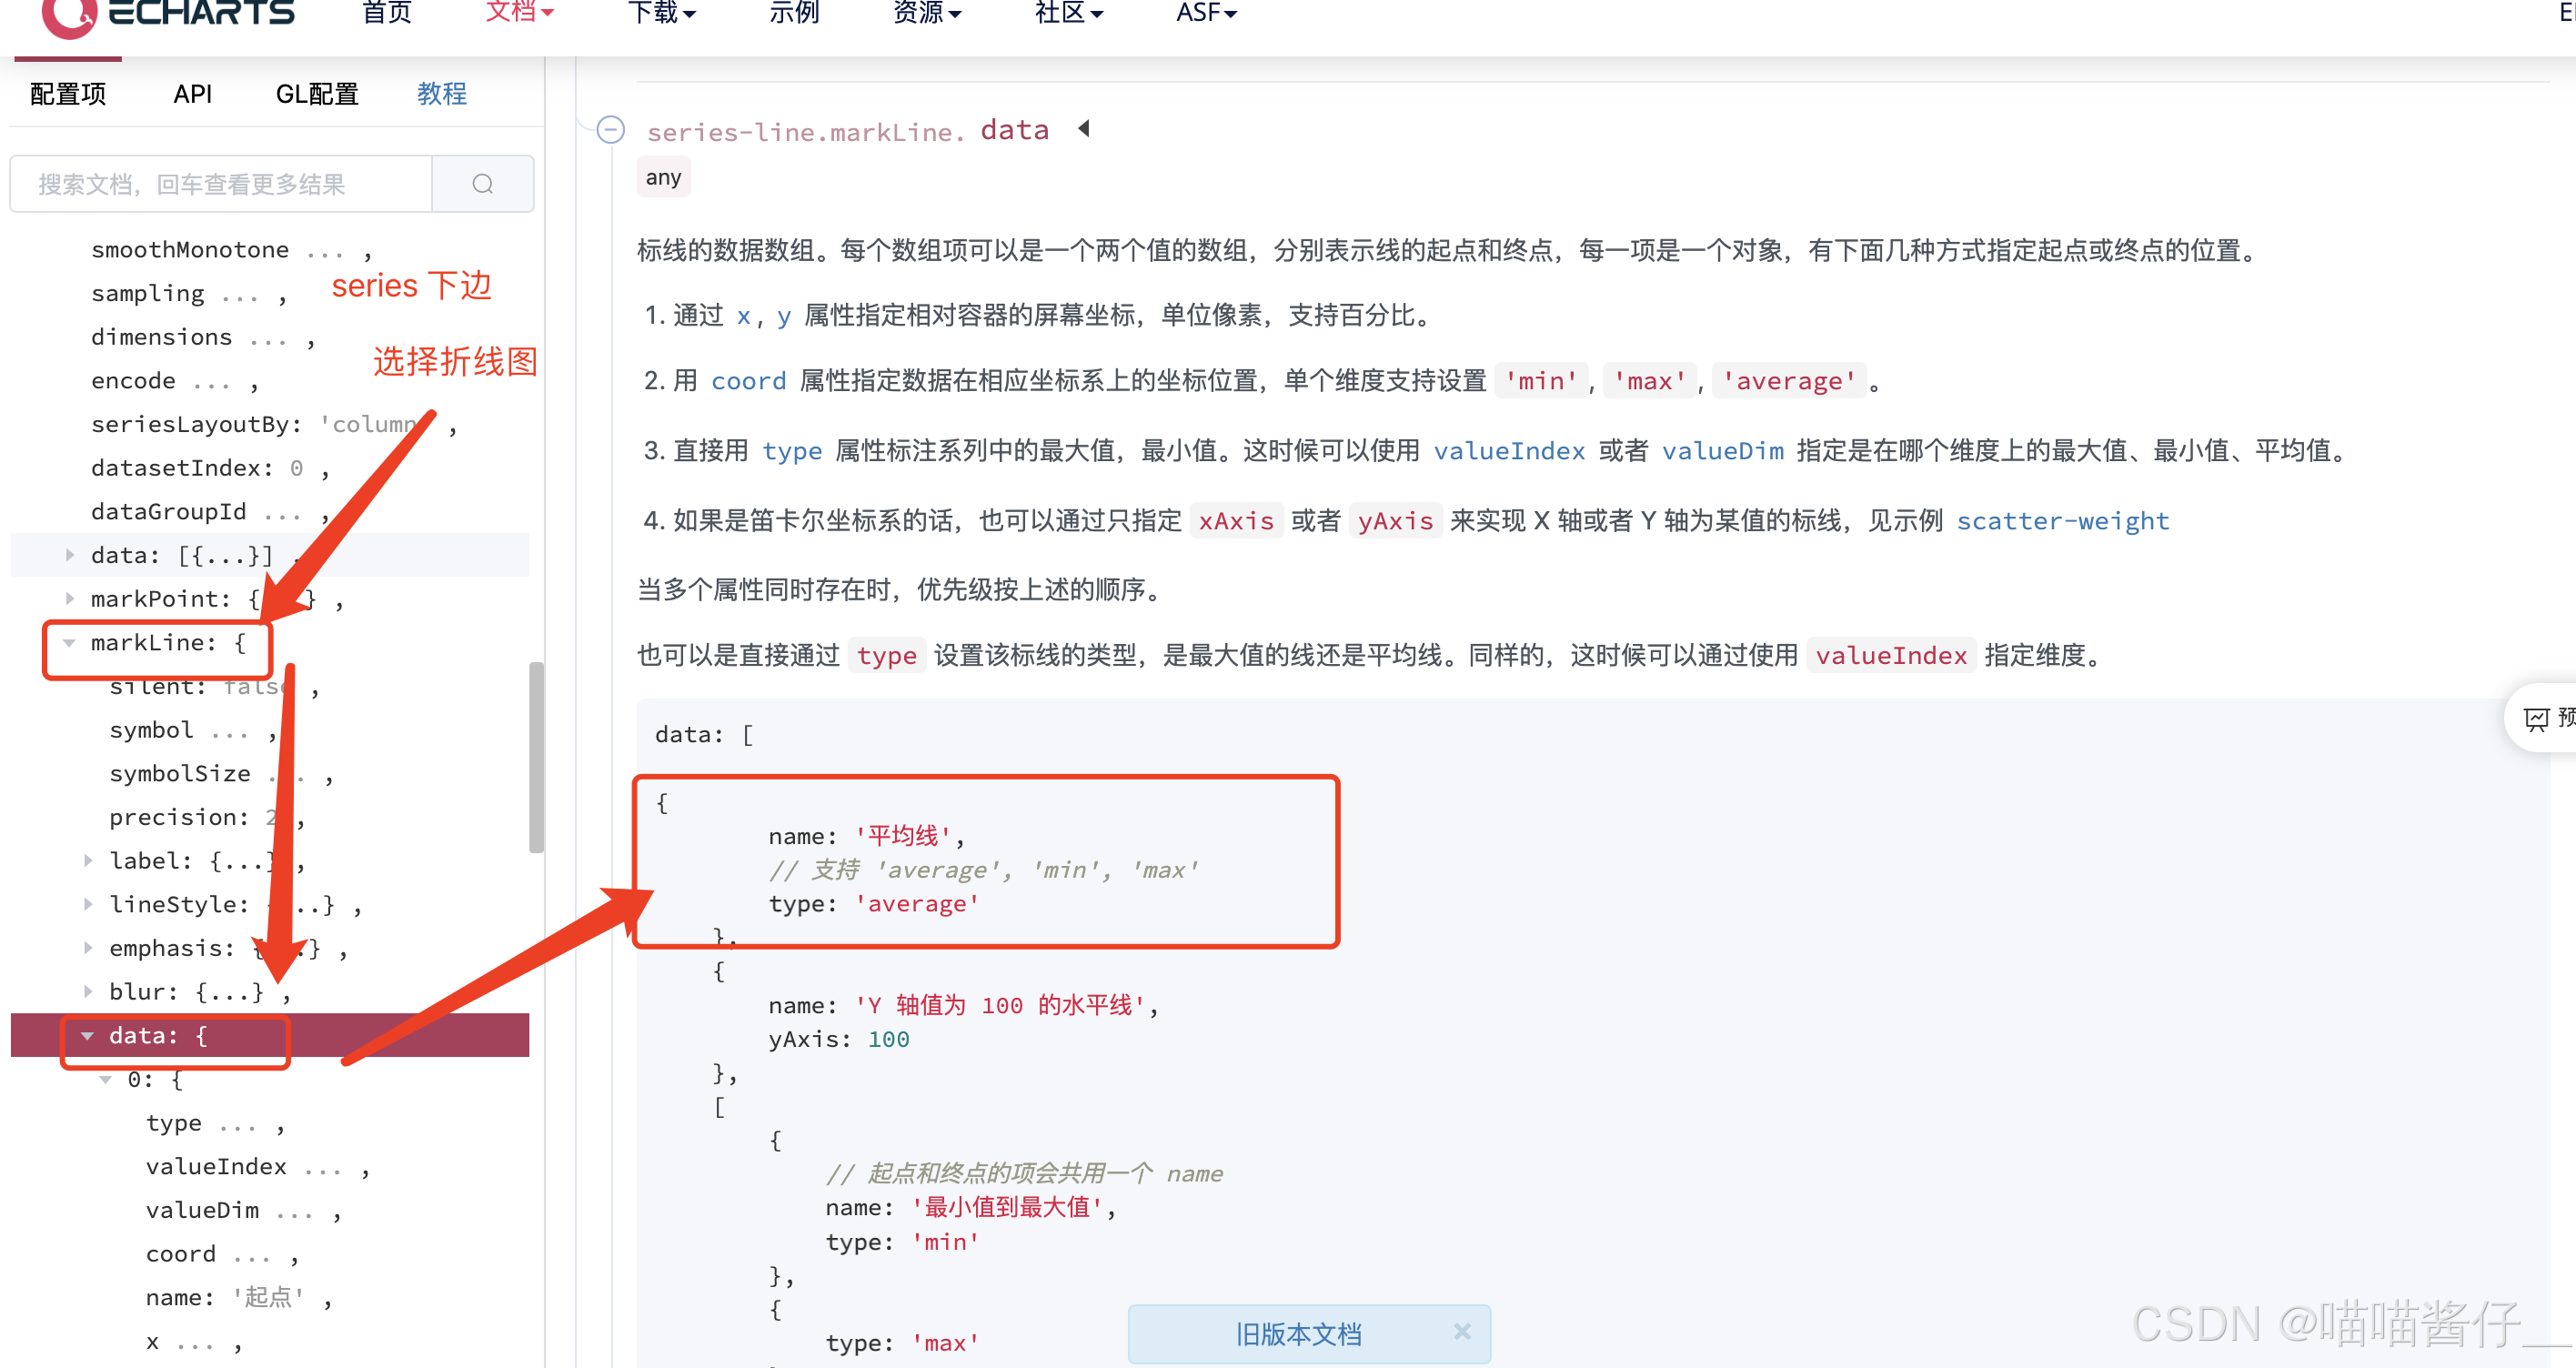
图表标线: markLine 下边有
注意 在series 当中
-
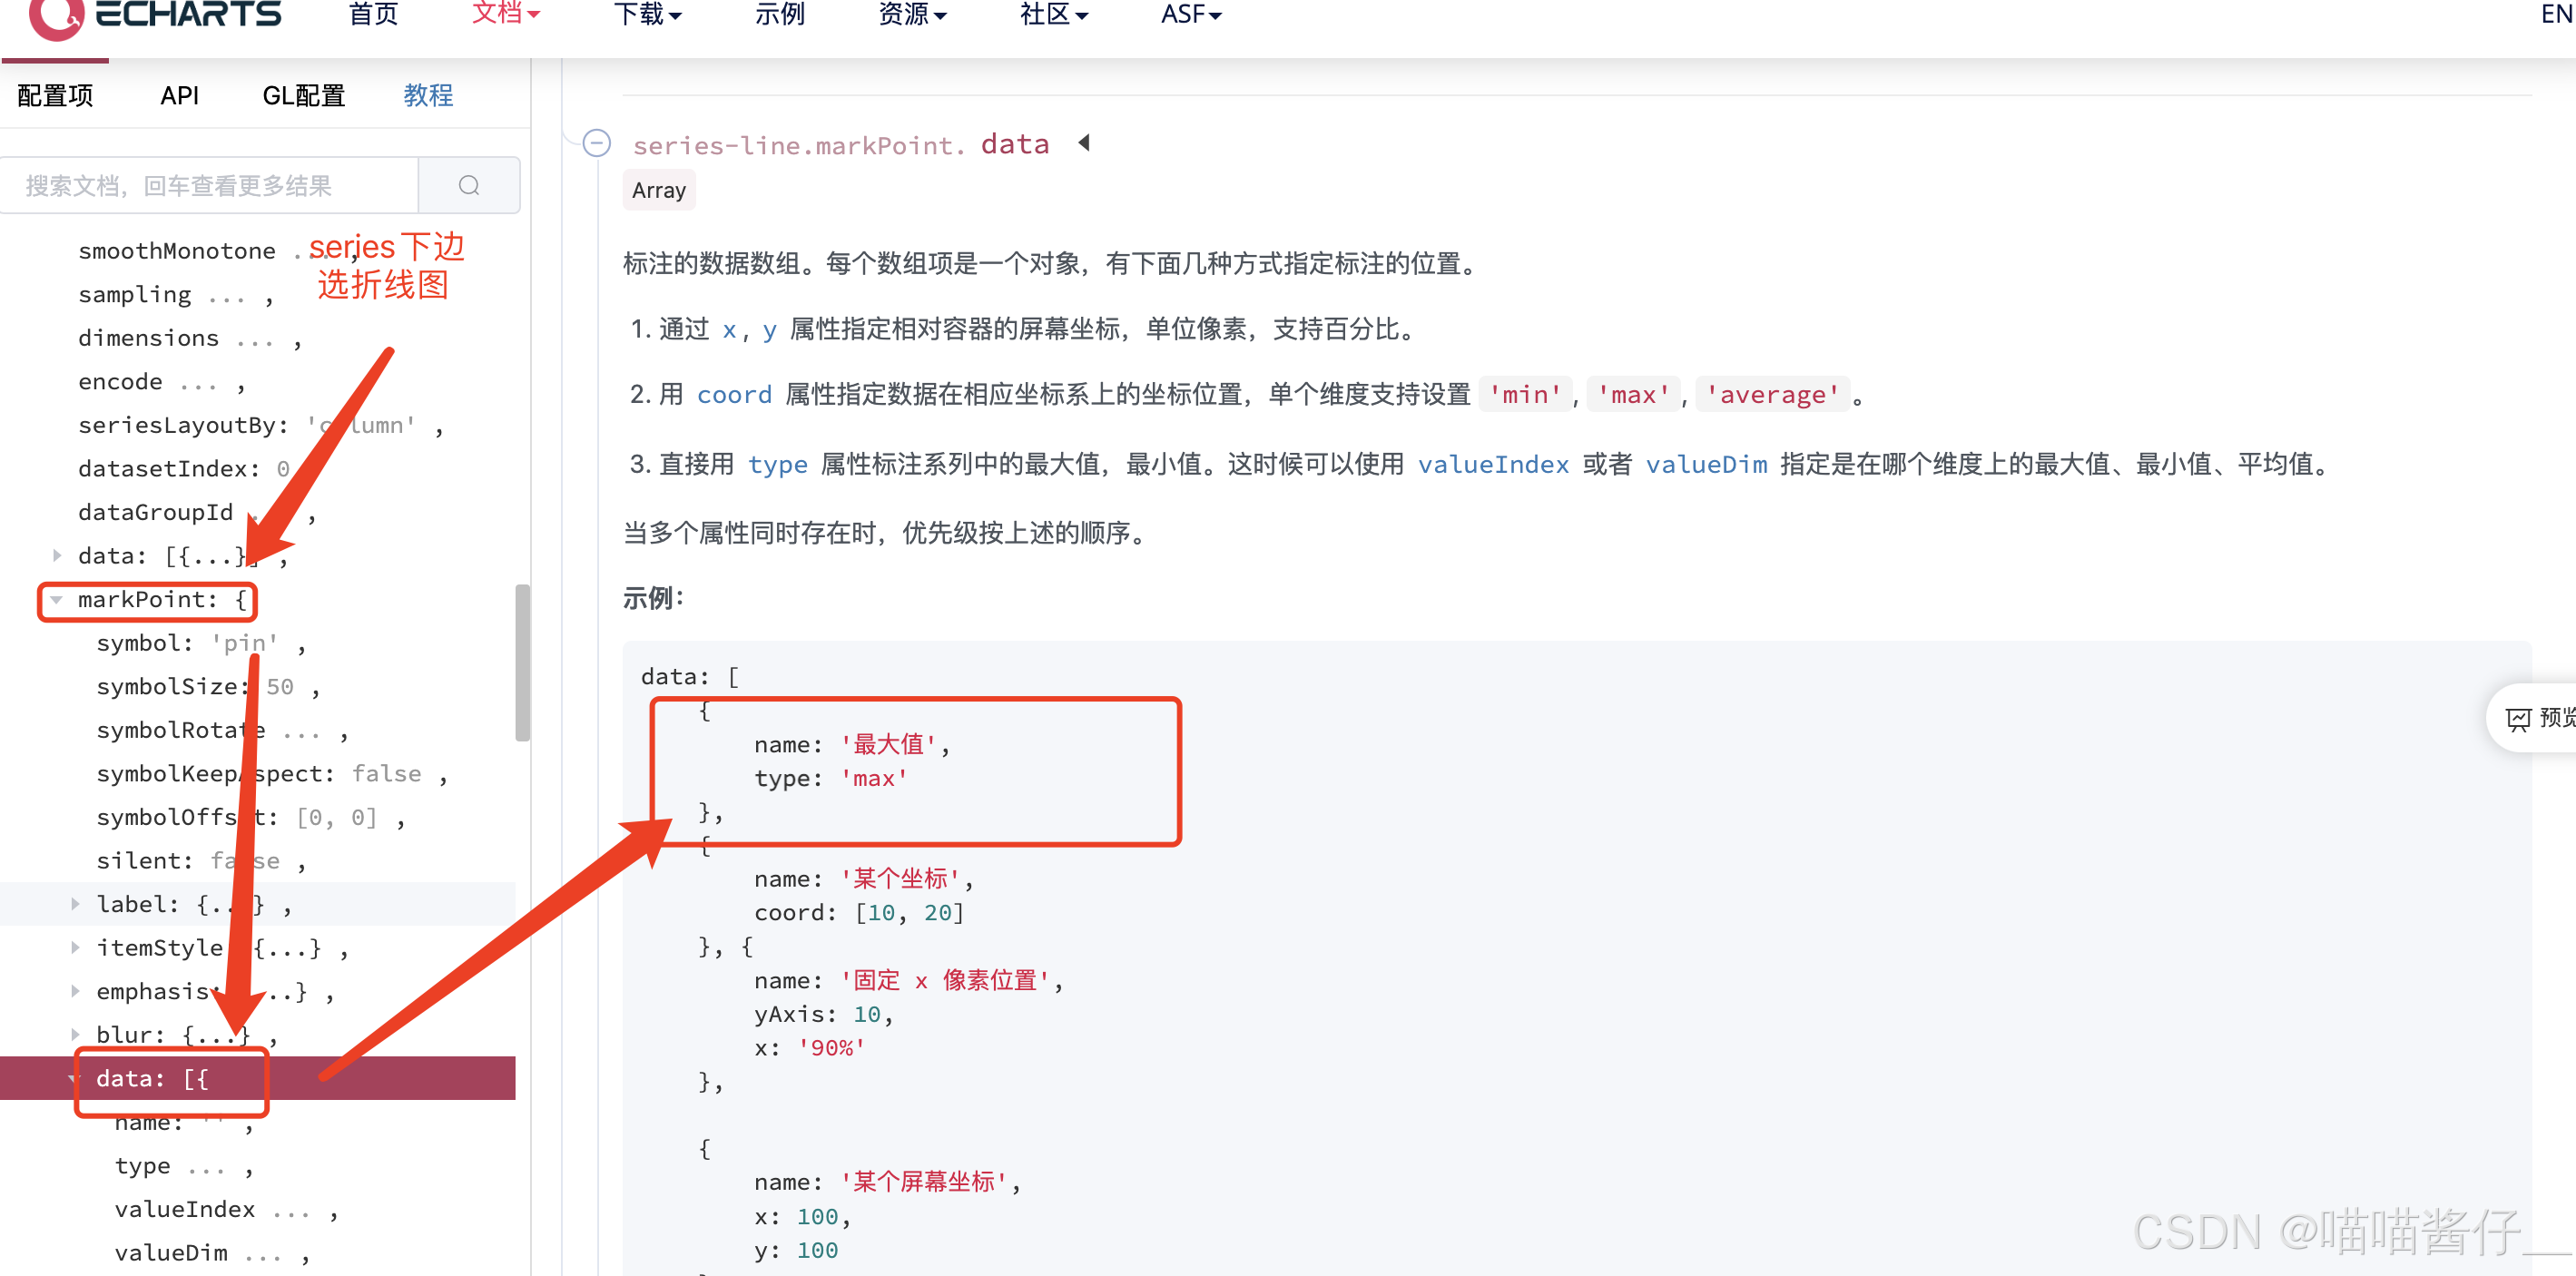
图表标注: markPoint
-
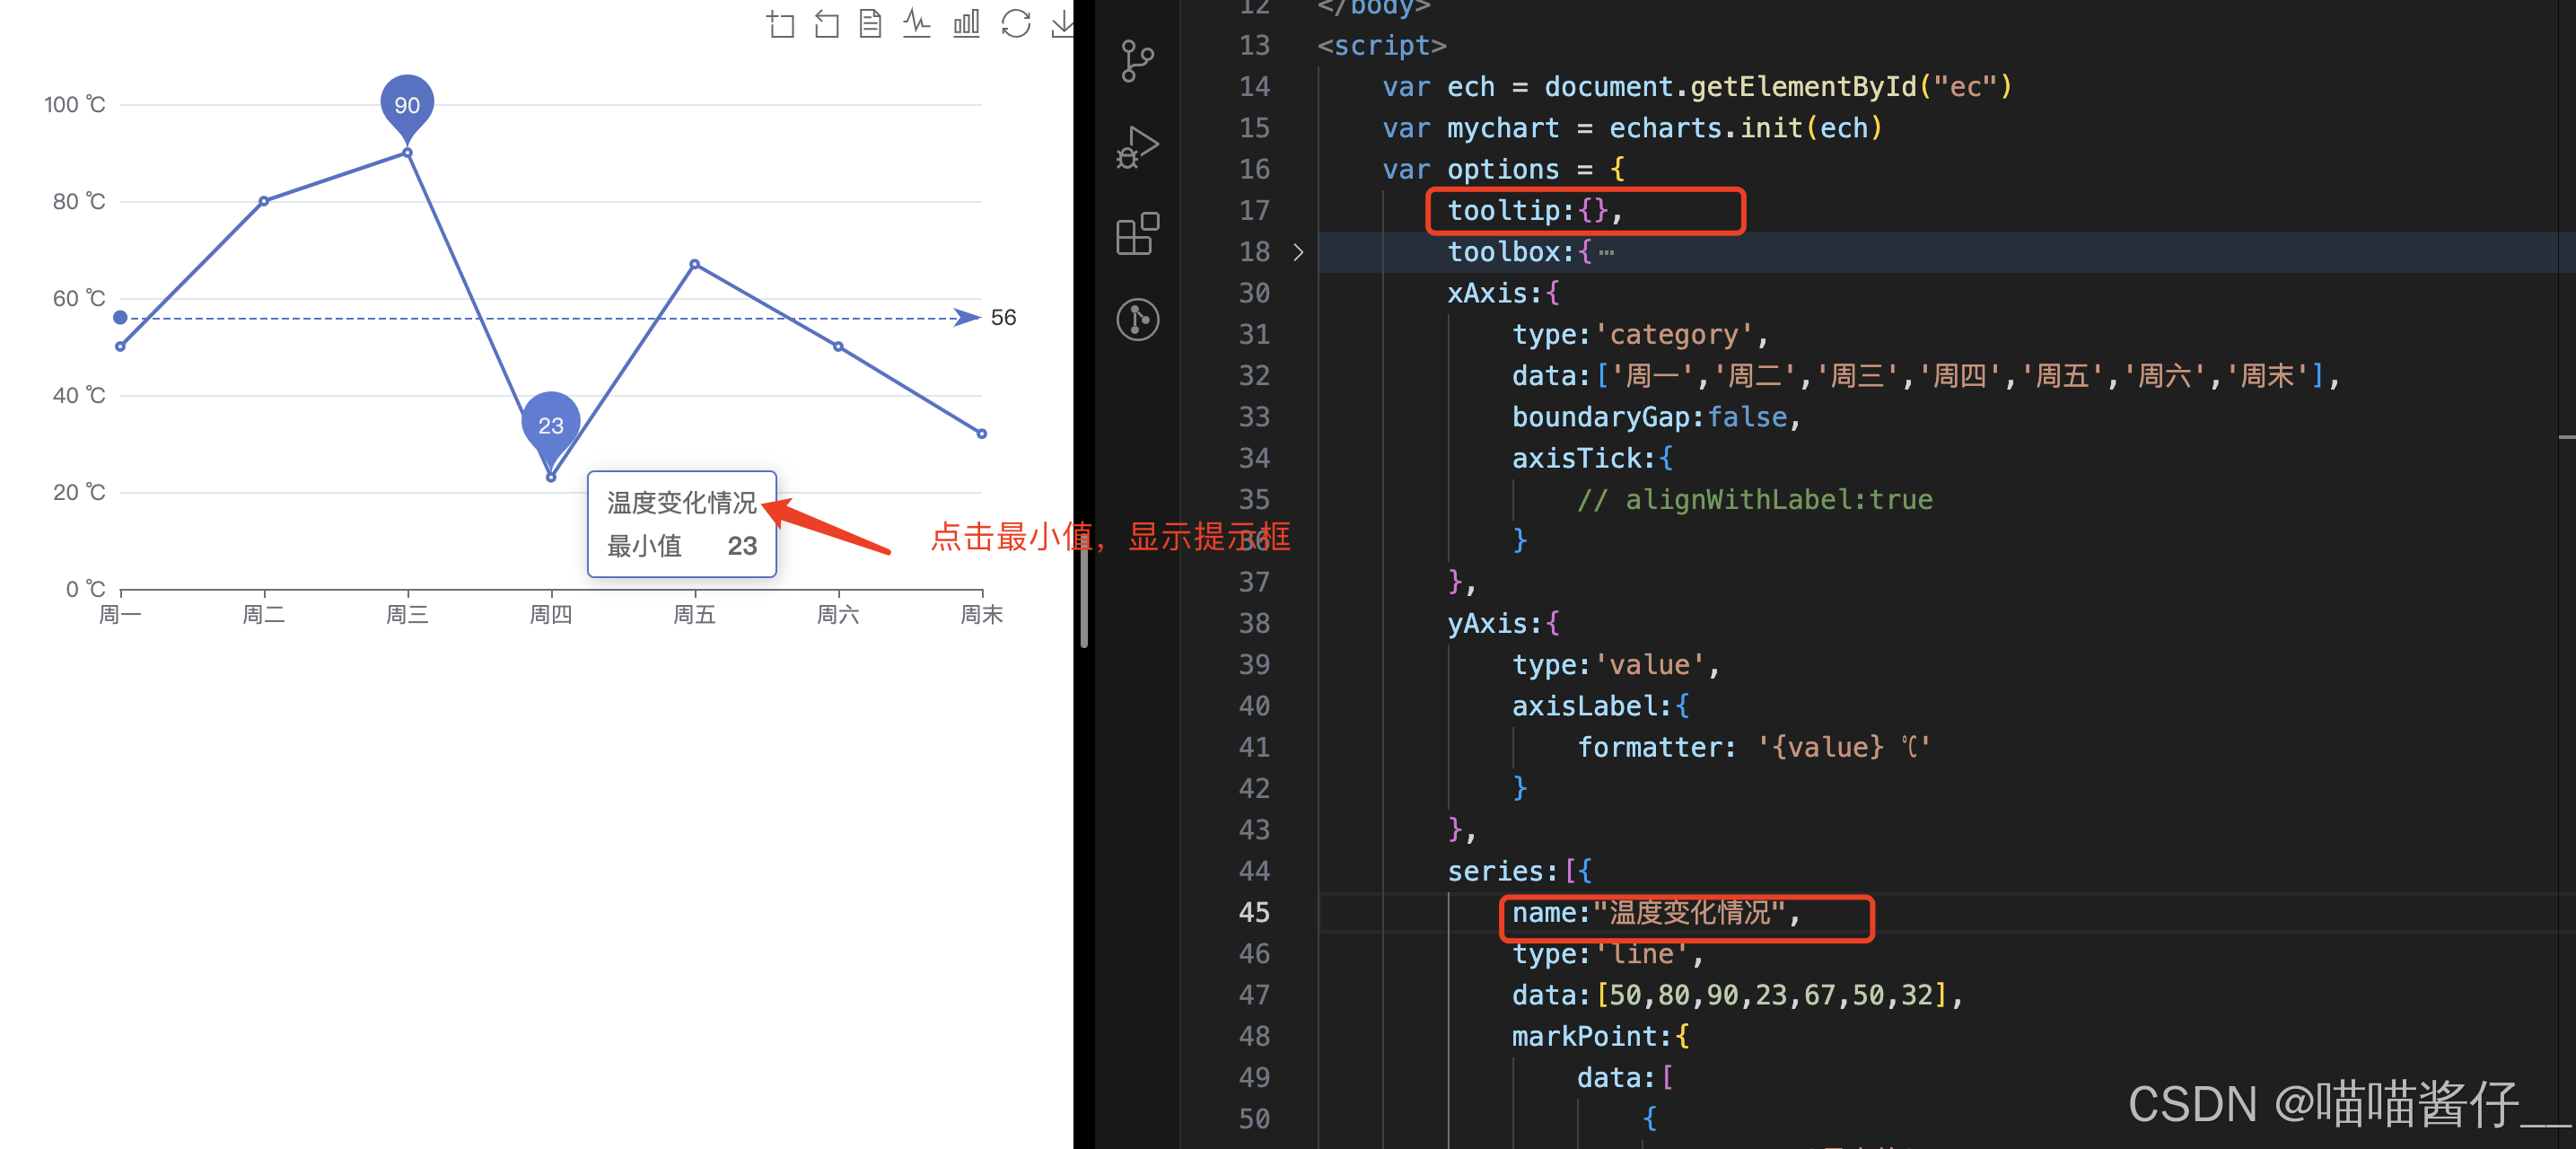
显示框
<!DOCTYPE html>
<html lang="en">
<head>
    <meta charset="UTF-8">
    <meta http-equiv="X-UA-Compatible" content="IE=edge">
    <meta name="viewport" content="width=device-width, initial-scale=1.0">
    <title>Document</title>
    <script src="./js/echarts.min.js"></script>
</head>
<body>
    <div id="ec" style="width:600px;height:400px"></div>
</body>
<script>
    var ech = document.getElementById("ec")
    var mychart = echarts.init(ech)
    var options = {
        tooltip:{},
        toolbox:{

            feature:{
                dataZoom:{},
                dataView:{},
                magicType:{
                    type:['line','bar']
                },
                restore:{},
                saveAsImage:{}
            }
        },
        xAxis:{
            type:'category',
            data:['周一','周二','周三','周四','周五','周六','周末'],
            // boundaryGap:false,
            axisTick:{
                // alignWithLabel:true
            }
        },
        yAxis:{
            type:'value',
            axisLabel:{
                formatter: '{value} ℃'
            }
        },
        series:[{
            name:"温度变化情况",
            type:'line',
            data:[50,80,90,23,67,50,32],
            markPoint:{
                data:[
                    {
                        name: '最大值',
                        type: 'max'
                    },
                    {
                        name: '最小值',
                        type: 'min'
                    }
                ]
            },
            markLine:{
                data:[
                    {
                        name: '平均线',
                        // 支持 'average', 'min', 'max'
                        type: 'average'
                    }
                ]
            }
        }]
    }
    mychart.setOption(options)
</script>
</html>
