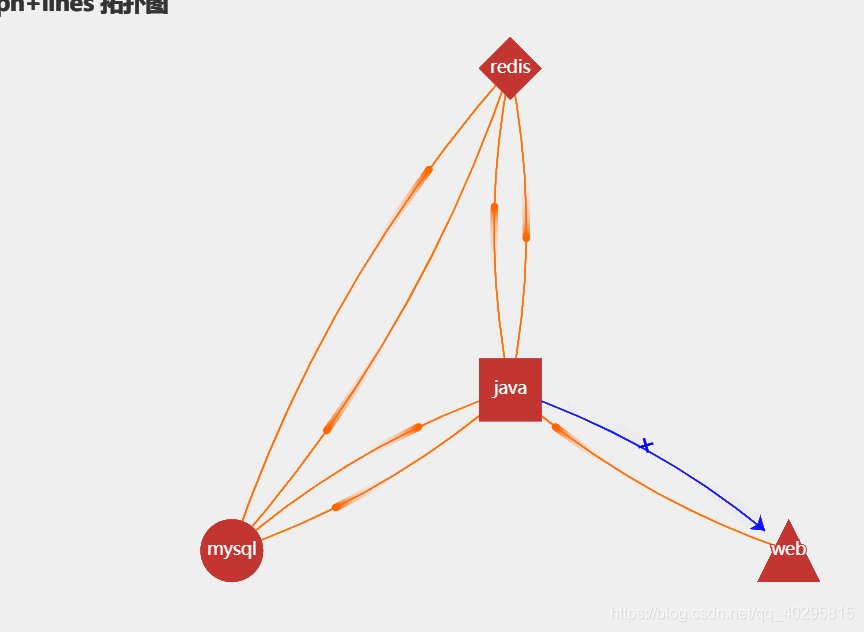
// 大体思路:
// 1, 节点
// 2, source 和 target
// 3, 错误的数据项用graph的links模拟
// 4, 正确的数据项用 lines 模拟(主要是为了动画)
// 5, 难题是节点多了坐标怎么计算


var nodes = [{
        name: 'java',
        value: [0, 0],
        symbol: 'rect'
    },
    {
        name: 'web',
        value: [1, 120],
        symbol: 'triangle'
    },
    {
        name: 'mysql',
        value: [1, 240]
    },
    {
        name: 'redis',
        value: [1, 360],
        symbol: 'diamond'
    }
]

var links = [{
    source: 'java',
    target: 'web',
    symbol: ['none', 'arrow'],
    label: {
        show: true,
        formatter: '×',
        padding: [0, 0, -13, 0],
        fontSize: 20,
    },
    lineStyle: {
        color: 'blue',
        curveness: 0.1,
    }

}, ];
var lines = [
    // {
    //     coords:[ [0, 0], [1, 120]],
    //     name: "×",
    //     label: {
    //         show: true,
    //         position: 'middle',
    //         color: 'red',
    //         fontSize: 20,
    //         padding: [0, 0, -13, 0]
    //     },
    //     effect:{
    //         show: false,
    //     }

    // },
    {
        coords: [
            [1, 120],
            [0, 0]
        ]
    },
    {
        coords: [
            [1, 240],
            [1, 360]
        ]
    },
    {
        coords: [
            [1, 360],
            [1, 240]
        ]
    },
    {
        coords: [
            [1, 240],
            [0, 0]
        ]
    },
    {
        coords: [
            [0, 0],
            [1, 240]
        ]
    },
    {
        coords: [
            [360],
            [0, 0]
        ]
    },
    {
        coords: [
            [0, 0],
            [1, 360]
        ]
    },
    {
        coords: [
            [1, 360],
            [0, 0],

        ]
    },
];


for (let i = 0; i < nodes.length; i++) {
    nodes[i].angle = (360 / nodes.length * i)
}

option = {
    title: {
        text: 'Graph+lines 拓扑图'
    },
    polar: {},
    radiusAxis: {
        show: false
    },
    angleAxis: {
        type: 'value',
        min: 0,
        max: 360,
        show: false
    },
    series: [{
            type: 'graph',
            coordinateSystem: 'polar',
            label: {
                show: true,
                position: 'inside',
                fontSize: 14
            },

            // layout:'circular',
            symbol: 'circle',
            symbolSize: 50,
            symbolPosition: 'start',
            nodes: nodes,
            links: links
        },
        {
            type: 'lines',
            coordinateSystem: 'polar',
            lineStyle: {
                color: '#f60',
                width: 1,
                opacity: 0.6,
                curveness: 0.1
            },
            effect: {
                symbol: 'pin',
                show: true,
                symbolSize: 10,
                trailLength: 0.1
            },
            data: lines
        }
    ]
};
效果图