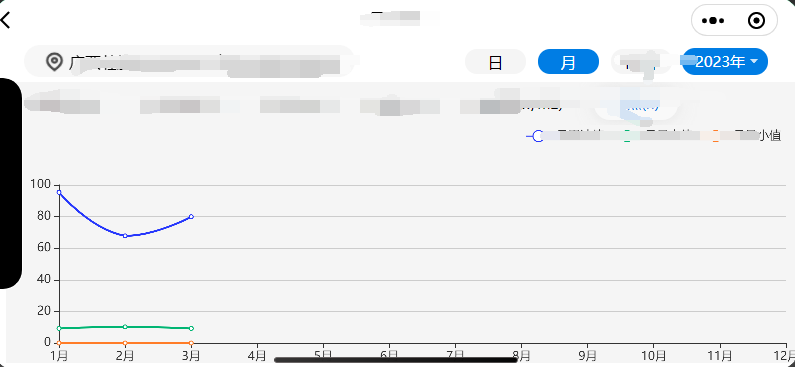
1.在小程序中可能会用到各种各样的图表那么在现实中我们不可能都手写,那么就会用到封装好的图标库,ec-canvas是个个非常好的。
2.如何使用呢?
<ec-canvas canvas-id="mychart-line" ec="{{ ec }}"></ec-canvas>
var options = {
    tooltip: {
        trigger: 'axis'
    },
    legend: {
        right: '2%',
        data: []
    },
    grid: {
        left: '3%',
        right: '2%',
        bottom: '0',
        containLabel: true
    },
    xAxis: {
        type: 'category',
        boundaryGap: false,
        data: []
    },
    yAxis: {
        type: 'value'
    },
    series: []
}

function initChart(canvas, width, height, dpr) { // 这部分是固定的不需要 是通用的
    console.log(width)
    console.log(height)
    chart = echarts.init(canvas, null, {
        width: width,
        height: height,
        devicePixelRatio: dpr // 像素
    });
    canvas.setChart(chart);
    // 这是 唯一需要更改的,可根据实际情况api更改图标
    // option里根据需求修改
    chart.setOption(options);
    return chart;
}


 ec: {
         onInit: initChart
      }
3.效果图
4.注意事项必需要给canvas设置高度,否则无法显示.

