✨博客主页:王乐予🎈
✨年轻人要:Living for the moment(活在当下)!💪
🏆推荐专栏:【图像处理】【千锤百炼Python】【深度学习】【排序算法】
在【深度学习经典网络架构—1】:LeNet(附Keras实现)中我们讲了深度学习的经典网络LeNet,并给出了Keras的实现;
在【深度学习实战—1】:基于Keras的手写数字识别(非常详细、代码开源)中我们介绍了Mnist手写数字数据集并自己搭建了一个简易网络用于手写数字的识别!
当我们学习了LeNet-5网络和MNIST数据集之后,就要将经典网络用于实战中了!文末附完整程序!
😺一、数据集获取
"""
数据集获取
"""
def get_mnist_data():

    (x_train_original, y_train_original), (x_test_original, y_test_original) = mnist.load_data()

    # 从训练集中分配验证集
    x_val = x_train_original[50000:]
    y_val = y_train_original[50000:]
    x_train = x_train_original[:50000]
    y_train = y_train_original[:50000]

    # 将图像转换为四维矩阵(nums,rows,cols,channels), 这里把数据从unint类型转化为float32类型, 提高训练精度。
    x_train = x_train.reshape(x_train.shape[0], 28, 28, 1).astype('float32')
    x_val = x_val.reshape(x_val.shape[0], 28, 28, 1).astype('float32')
    x_test = x_test_original.reshape(x_test_original.shape[0], 28, 28, 1).astype('float32')

    # 原始图像的像素灰度值为0-255,为了提高模型的训练精度,通常将数值归一化映射到0-1。
    x_train = x_train / 255
    x_val = x_val / 255
    x_test = x_test / 255

    # 图像标签一共有10个类别即0-9,这里将其转化为独热编码(One-hot)向量
    y_train = np_utils.to_categorical(y_train)
    y_val = np_utils.to_categorical(y_val)
    y_test = np_utils.to_categorical(y_test_original)

    return x_train, y_train, x_val, y_val, x_test, y_test
😺二、定义LeNet-5
"""
定义LeNet-5网络模型
"""
def LeNet5():

    input_shape = Input(shape=(28, 28, 1))

    x = Conv2D(6, (5, 5), activation="relu", padding="same")(input_shape)
    x = MaxPooling2D((2, 2), 2)(x)
    x = Conv2D(16, (5, 5), activation="relu", padding='same')(x)
    x = MaxPooling2D((2, 2), 2)(x)

    x = Flatten()(x)
    x = Dense(120, activation='relu')(x)
    x = Dense(84, activation='relu')(x)
    x = Dense(10, activation='softmax')(x)

    model = Model(input_shape, x)
    print(model.summary())

    return model
😺三、编译并训练
"""
编译网络并训练
"""
x_train, y_train, x_val, y_val, x_test, y_test = get_mnist_data()
model = LeNet5()

# 编译网络(定义损失函数、优化器、评估指标)
model.compile(loss='categorical_crossentropy', optimizer='adam', metrics=['accuracy'])

# 开始网络训练(定义训练数据与验证数据、定义训练代数,定义训练批大小)
train_history = model.fit(x_train, y_train, validation_data=(x_val, y_val), epochs=20, batch_size=32, verbose=2)

# 模型保存
model.save('lenet_mnist.h5')

# 定义训练过程可视化函数(训练集损失、验证集损失、训练集精度、验证集精度)
def show_train_history(train_history, train, validation):
    plt.plot(train_history.history[train])
    plt.plot(train_history.history[validation])
    plt.title('Train History')
    plt.ylabel(train)
    plt.xlabel('Epoch')
    plt.legend(['train', 'validation'], loc='best')
    plt.show()

show_train_history(train_history, 'accuracy', 'val_accuracy')
show_train_history(train_history, 'loss', 'val_loss')
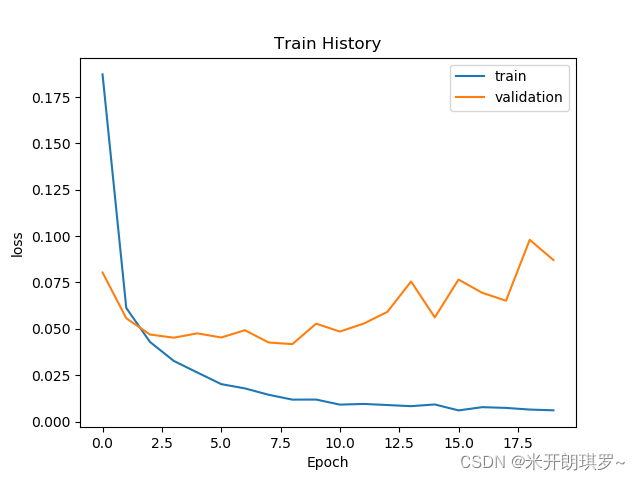
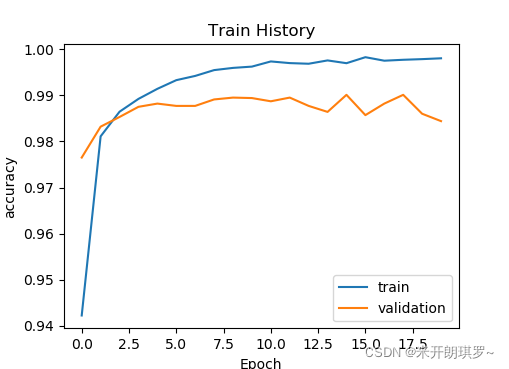
训练过程如下:
😺四、测试模型
# 输出网络在测试集上的损失与精度
score = model.evaluate(x_test, y_test)
print('Test loss:', score[0])
print('Test accuracy:', score[1])

# 测试集结果预测
predictions = model.predict(x_test)
predictions = np.argmax(predictions, axis=1)
print('前20张图片预测结果:', predictions[:20])
测试结果:
Test loss: 0.07095145434141159
Test accuracy: 0.986299991607666
前20张图片预测结果: [7 2 1 0 4 1 4 9 5 9 0 6 9 0 1 5 9 7 3 4]
😺五、预测结果可视化
# 预测结果图像可视化
(x_train_original, y_train_original), (x_test_original, y_test_original) = mnist.load_data()
def mnist_visualize_multiple_predict(start, end, length, width):

    for i in range(start, end):
        plt.subplot(length, width, 1 + i)
        plt.imshow(x_test_original[i], cmap=plt.get_cmap('gray'))
        title_true = 'true=' + str(y_test_original[i])
        title_prediction = ',' + 'prediction' + str(model.predict_classes(np.expand_dims(x_test[i], axis=0)))
        title = title_true + title_prediction
        plt.title(title)
        plt.xticks([])
        plt.yticks([])
    plt.show()

mnist_visualize_multiple_predict(start=0, end=9, length=3, width=3)
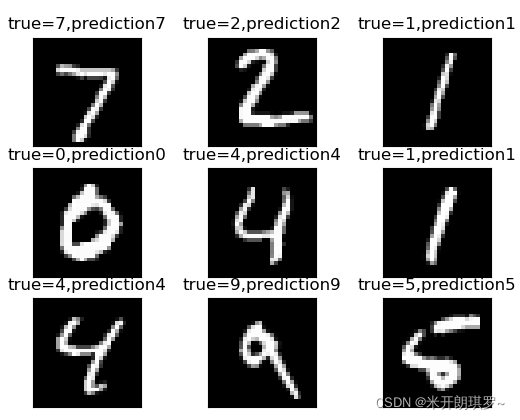
可视化结果:
😺六、建立混淆矩阵
# 混淆矩阵
cm = confusion_matrix(y_test_original, predictions)
cm = pd.DataFrame(cm)
class_names = ['0', '1', '2', '3', '4', '5', '6', '7', '8', '9']

def plot_confusion_matrix(cm):
    plt.figure(figsize=(10, 10))
    sns.heatmap(cm, cmap='Oranges', linecolor='black', linewidth=1, annot=True, fmt='', xticklabels=class_names, yticklabels=class_names)
    plt.xlabel("Predicted")
    plt.ylabel("Actual")
    plt.title("Confusion Matrix")
    plt.show()

plot_confusion_matrix(cm)
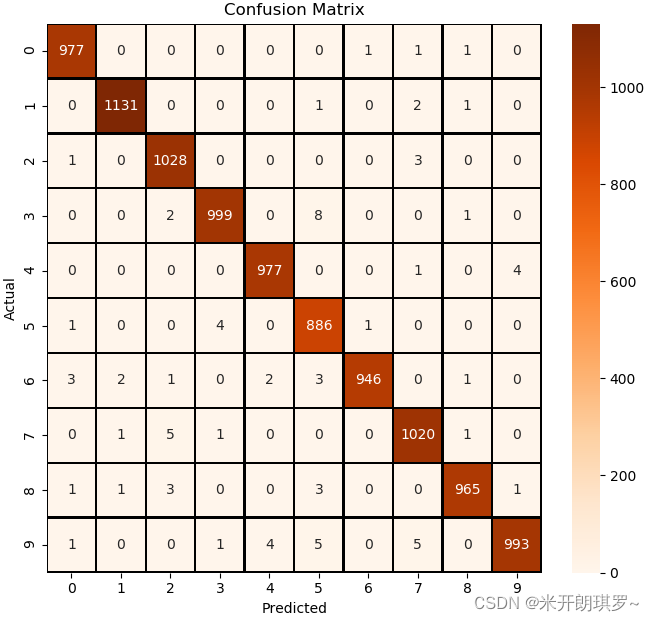
混淆矩阵:
😺附录:完整程序
from keras.datasets import mnist
import matplotlib.pyplot as plt
import numpy as np
import pandas as pd
import seaborn as sns
from sklearn.metrics import confusion_matrix
from tensorflow.keras.layers import Conv2D, MaxPooling2D, Flatten, Dense, Input, Dropout
from keras.models import Model
from keras.utils import np_utils


"""
数据集获取
"""
def get_mnist_data():

    (x_train_original, y_train_original), (x_test_original, y_test_original) = mnist.load_data()

    # 从训练集中分配验证集
    x_val = x_train_original[50000:]
    y_val = y_train_original[50000:]
    x_train = x_train_original[:50000]
    y_train = y_train_original[:50000]

    # 将图像转换为四维矩阵(nums,rows,cols,channels), 这里把数据从unint类型转化为float32类型, 提高训练精度。
    x_train = x_train.reshape(x_train.shape[0], 28, 28, 1).astype('float32')
    x_val = x_val.reshape(x_val.shape[0], 28, 28, 1).astype('float32')
    x_test = x_test_original.reshape(x_test_original.shape[0], 28, 28, 1).astype('float32')

    # 原始图像的像素灰度值为0-255,为了提高模型的训练精度,通常将数值归一化映射到0-1。
    x_train = x_train / 255
    x_val = x_val / 255
    x_test = x_test / 255

    # 图像标签一共有10个类别即0-9,这里将其转化为独热编码(One-hot)向量
    y_train = np_utils.to_categorical(y_train)
    y_val = np_utils.to_categorical(y_val)
    y_test = np_utils.to_categorical(y_test_original)

    return x_train, y_train, x_val, y_val, x_test, y_test


"""
定义LeNet-5网络模型
"""
def LeNet5():

    input_shape = Input(shape=(28, 28, 1))

    x = Conv2D(6, (5, 5), activation="relu", padding="same")(input_shape)
    x = MaxPooling2D((2, 2), 2)(x)
    x = Conv2D(16, (5, 5), activation="relu", padding='same')(x)
    x = MaxPooling2D((2, 2), 2)(x)

    x = Flatten()(x)
    x = Dense(120, activation='relu')(x)
    x = Dense(84, activation='relu')(x)
    x = Dense(10, activation='softmax')(x)

    model = Model(input_shape, x)
    print(model.summary())

    return model

"""
编译网络并训练
"""
x_train, y_train, x_val, y_val, x_test, y_test = get_mnist_data()
model = LeNet5()

# 编译网络(定义损失函数、优化器、评估指标)
model.compile(loss='categorical_crossentropy', optimizer='adam', metrics=['accuracy'])

# 开始网络训练(定义训练数据与验证数据、定义训练代数,定义训练批大小)
train_history = model.fit(x_train, y_train, validation_data=(x_val, y_val), epochs=20, batch_size=32, verbose=2)

# 模型保存
model.save('lenet_mnist.h5')

# 定义训练过程可视化函数(训练集损失、验证集损失、训练集精度、验证集精度)
def show_train_history(train_history, train, validation):
    plt.plot(train_history.history[train])
    plt.plot(train_history.history[validation])
    plt.title('Train History')
    plt.ylabel(train)
    plt.xlabel('Epoch')
    plt.legend(['train', 'validation'], loc='best')
    plt.show()

show_train_history(train_history, 'accuracy', 'val_accuracy')
show_train_history(train_history, 'loss', 'val_loss')

# 输出网络在测试集上的损失与精度
score = model.evaluate(x_test, y_test)
print('Test loss:', score[0])
print('Test accuracy:', score[1])

# 测试集结果预测
predictions = model.predict(x_test)
predictions = np.argmax(predictions, axis=1)
print('前20张图片预测结果:', predictions[:20])

# 预测结果图像可视化
(x_train_original, y_train_original), (x_test_original, y_test_original) = mnist.load_data()
def mnist_visualize_multiple_predict(start, end, length, width):

    for i in range(start, end):
        plt.subplot(length, width, 1 + i)
        plt.imshow(x_test_original[i], cmap=plt.get_cmap('gray'))
        title_true = 'true=' + str(y_test_original[i])
        # title_prediction = ',' + 'prediction' + str(model.predict_classes(np.expand_dims(x_test[i], axis=0)))
        title_prediction = ',' + 'prediction' + str(predictions[i])
        title = title_true + title_prediction
        plt.title(title)
        plt.xticks([])
        plt.yticks([])
    plt.show()

mnist_visualize_multiple_predict(start=0, end=9, length=3, width=3)

# 混淆矩阵
cm = confusion_matrix(y_test_original, predictions)
cm = pd.DataFrame(cm)
class_names = ['0', '1', '2', '3', '4', '5', '6', '7', '8', '9']

def plot_confusion_matrix(cm):
    plt.figure(figsize=(10, 10))
    sns.heatmap(cm, cmap='Oranges', linecolor='black', linewidth=1, annot=True, fmt='', xticklabels=class_names, yticklabels=class_names)
    plt.xlabel("Predicted")
    plt.ylabel("Actual")
    plt.title("Confusion Matrix")
    plt.show()

plot_confusion_matrix(cm)


