一个非常好用的科学绘图库
本来今天是要继续更新pandas库的操作的,但是突然被matplotlib这个非常好用的绘图工具所吸引,就让我们来看一下叭。
~~~感觉numpy + matplotlib真的可以替代matlab了呀)//滑稽
初识matplotlib:
- 先画一个简单的抛物线:
import matplotlib.pyplot as plt
import numpy as np
x = np.linspace(-1, 1, 1000)
y = x ** 2
plt.figure()
plt.plot(x, y)
plt.show()
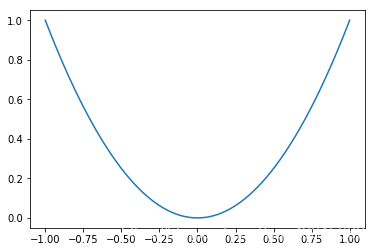
输出展示:
说明:(1)np.linspace相当于生成了一个x轴,前两个数据规定定义域, 第三个数据为定义域内生成的点的个数。
(2)plt.figure生成了一个图,后面的plt.plot(x, y)即为在图中展示的函数关系,plt.show()正式输出函数图像。
绘图进阶:
- 绘制两个函数图:
x = np.linspace(-1, 1, 1000)
y1 = x ** 2
y2 = x ** 3
plt.figure()
plt.plot(x, y1)
plt.figure()
plt.plot(x, y2)
plt.show()
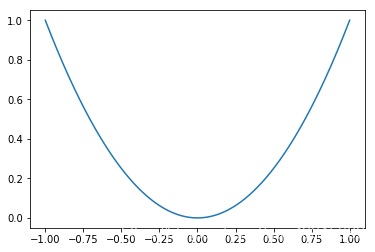
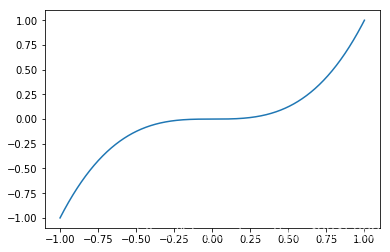
绘图展示:
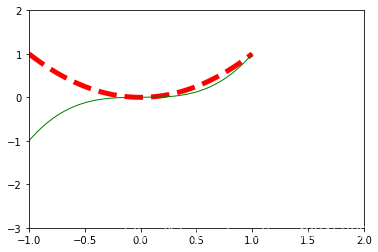
如果我们想将两个函数进行对比,要将其放入一个图形中,可以这样做:
- 绘图第二弹:
x = np.linspace(-1, 1, 1000)
y1 = x ** 2
y2 = x ** 3
plt.figure()
plt.plot(x, y1, color = 'red', linewidth = 5, linestyle = '--')
plt.plot(x, y2, color = 'green', linewidth = 1, linestyle = '-')
plt.show()
绘图展示:
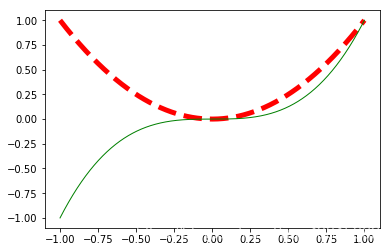
(2)plot中可以调整曲线的格式color代表曲线颜色, linewidth代表曲线的宽度, linestyle中 ‘–’ 表示虚线, ’ - ’ 表示实线。
进行坐标轴的设定
- 设定显示的坐标范围:
x = np.linspace(-1, 1, 1000)
y1 = x ** 2
y2 = x ** 3
plt.figure()
plt.xlim(-1, 2) #设置x的显示范围
plt.ylim(-3, 2) #设置y的显示范围
plt.plot(x, y1, color = 'red', linewidth = 5, linestyle = '--')
plt.plot(x, y2, color = 'green', linewidth = 1, linestyle = '-')
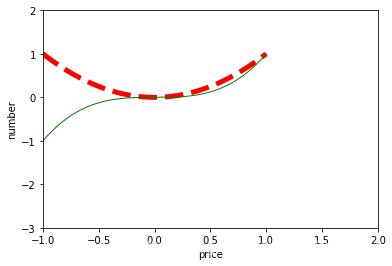
plt.show()
图像展示:
- 设定坐标轴名称:
x = np.linspace(-1, 1, 1000)
y1 = x ** 2
y2 = x ** 3
plt.figure()
plt.xlim(-1, 2)
plt.ylim(-3, 2)
plt.xlabel('price') # 设定x轴标签
plt.ylabel('number') # 设定y轴标签
plt.plot(x, y1, color = 'red', linewidth = 5, linestyle = '--')
plt.plot(x, y2, color = 'green', linewidth = 1, linestyle = '-')
plt.show()
图片展示;
- 设置坐标间距:
x = np.linspace(-1, 1, 1000)
y1 = x ** 2
y2 = x ** 3
plt.figure()
plt.xlim(-2, 2)
plt.ylim(-2, 2)
x_interval = np.linspace(-2, 2, 11)
y_interval = np.linspace(-2, 2, 11)
plt.xticks(x_interval)
plt.yticks(y_interval)
plt.xlabel('price')
plt.ylabel('number')
plt.plot(x, y1, color = 'red', linewidth = 5, linestyle = '--')
plt.plot(x, y2, color = 'green', linewidth = 1, linestyle = '-')
plt.show()
图像展示:
- 间隔不仅是数字,还可以是文字描述:
x = np.linspace(-1, 1, 1000)
y1 = x ** 2
y2 = x ** 3
plt.figure()
plt.xlim(-2, 2)
plt.ylim(-2, 2)
x_interval = np.linspace(-2, 2, 11)
plt.xticks(x_interval)
plt.yticks([-2, -1, 0, 1, 2], ['level1', 'level2', 'level3', 'level4', 'level5'])
plt.xlabel('price')
plt.ylabel('number')
plt.plot(x, y1, color = 'red', linewidth = 5, linestyle = '--')
plt.plot(x, y2, color = 'green', linewidth = 1, linestyle = '-')
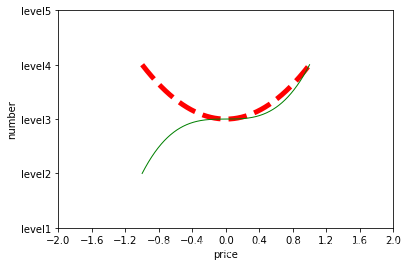
plt.show()
图形展示:
- 建立出真正的坐标系:
x = np.linspace(-1, 1, 1000)
y1 = x ** 2
y2 = x ** 3
plt.figure()
plt.xlim(-2, 2)
plt.ylim(-2, 2)
x_interval = np.linspace(-2, 2, 11)
plt.xticks(x_interval)
plt.yticks([-2, -1, 0, 1, 2], ['level1', 'level2', 'level3', 'level4', 'level5'])
plt.xlabel('price')
plt.ylabel('number')
plt.plot(x, y1, color = 'red', linewidth = 5, linestyle = '--')
plt.plot(x, y2, color = 'green', linewidth = 1, linestyle = '-')
#获取当前坐标轴
a = plt.gca()
#设置右轴,上轴的颜色为无(消去边框)
a.spines['right'].set_color('none')
a.spines['top'].set_color('none')
# 设置下轴和左轴为x, y轴
a.xaxis.set_ticks_position('bottom')
a.yaxis.set_ticks_position('left')
# 将左下两轴置于零点
a.spines['bottom'].set_position(('data', 0))
a.spines['left'].set_position(('data', 0))
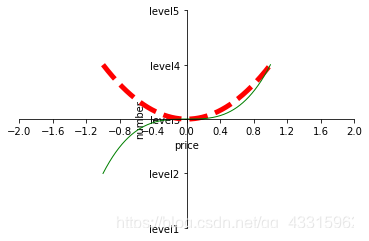
plt.show()
图片展示:
明天继续更新叭
