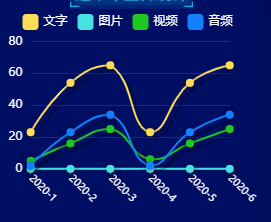
echarts-折线图,动态
代码
<template>
<div style="width: 100%; height: 100%" id="chartsR"></div>
</template>
<script>
import echarts from "echarts";
export default {
mounted() {
this.drawLine();
},
methods: {
drawLine() {
let myChart = echarts.init(document.getElementById("chartsR"));
let dataTime = [
"2020-1",
"2020-2",
"2020-3",
"2020-4",
"2020-5",
"2020-6",
];
let web = [23, 54, 65, 23, 54, 65,];
let app = [0, 0, 0, 0, 0, 0];
let weChat = [5, 16, 25, 6, 16, 25];
let microblog = [2, 23, 34, 2, 23, 34];
let option = {
legend: {
// type: "scroll"
icon: "roundRect",
// itemGap: 40,//
textStyle: {
color: "#fff",
},
itemWidth: 16,
itemHeight: 16,
},
tooltip: {
trigger: "axis",
textStyle: {
align: "center",
},
axisPointer: {
lineStyle: {
color: {
type: "linear",
x: 0,
y: 0,
x2: 0,
y2: 1,
colorStops: [
{
offset: 0,
color: "rgba(0, 255, 233,0)",
},
{
offset: 0.5,
color: "rgba(255, 255, 255,1)",
},
{
offset: 1,
color: "rgba(0, 255, 233,0)",
},
],
global: false,
},
},
},
},
grid: {
top: "15%",
left: "14%",
right: "12%",
bottom: "26%",
// containLabel: true
},
xAxis: [
{
type: "category",
axisLabel: {
rotate: -45,
color: "#fff",
interval: 0,
textStyle: {
fontSize: 10,
},
fontFamily: "LCDEF",
},
axisTick: {
lineStyle: {
//刻度颜色
color: "#6499B9",
},
},
axisLine: {
show: true,
textStyle: {
color: "#fff",
},
lineStyle: {
//刻度线颜色
color: "#132F7A",
},
},
splitArea: {
// show: true,
color: "#fff",
lineStyle: {
color: "#fff",
},
},
// axisLabel: {
// color: '#fff'
// },
splitLine: {
show: false,
},
boundaryGap: false,
data: dataTime,
},
],
yAxis: [
{
type: "value",
min: 0,
// max: 140,
splitNumber: 4,
splitLine: {
show: true,
lineStyle: {
color: "#132F7A", //网格线颜色
},
},
axisLine: {
//刻度线
show: false,
},
axisLabel: {
//刻度
// show: false,
// margin: 20,
textStyle: {
color: "#fff",
},
},
axisTick: {
show: false,
},
},
],
series: [
{
name: "文字",
type: "line",
smooth: true, //是否平滑
showAllSymbol: true,
// symbol: 'image://./static/images/guang-circle.png',
symbol: "circle",
symbolSize: 8,
lineStyle: {
normal: {
color: "#FEDC56",
shadowColor: "rgba(0, 0, 0, .3)",
shadowBlur: 0,
shadowOffsetY: 5,
shadowOffsetX: 5,
},
},
itemStyle: {
color: "#FEDC56",
// borderColor: "#fff",
borderWidth: 3,
shadowColor: "rgba(0, 0, 0, .5)",
shadowBlur: 6,
// shadowOffsetY: 2,
// shadowOffsetX: 2,
},
tooltip: {
show: true,
},
data: web,
},
{
name: "图片",
type: "line",
smooth: true, //是否平滑
showAllSymbol: true,
// symbol: 'image://./static/images/guang-circle.png',
symbol: "circle",
symbolSize: 8,
lineStyle: {
normal: {
color: "#47E1E2",
shadowColor: "rgba(0, 0, 0, .3)",
shadowBlur: 0,
shadowOffsetY: 5,
shadowOffsetX: 5,
},
},
itemStyle: {
//点
color: "#47E1E2",
// borderColor: "#fff",
borderWidth: 3,
shadowColor: "rgba(0, 0, 0, .5)",
shadowBlur: 6,
shadowOffsetY: 2,
shadowOffsetX: 2,
},
tooltip: {
show: true,
},
data: app,
},
{
name: "视频",
type: "line",
smooth: true, //是否平滑
showAllSymbol: true,
// symbol: 'image://./static/images/guang-circle.png',
symbol: "circle",
symbolSize: 8,
lineStyle: {
normal: {
color: "#1FC823",
shadowColor: "rgba(0, 0, 0, .3)",
shadowBlur: 0,
shadowOffsetY: 5,
shadowOffsetX: 5,
},
},
itemStyle: {
color: "#1FC823",
// borderColor: "#fff",
borderWidth: 3,
shadowColor: "rgba(0, 0, 0, .5)",
shadowBlur: 6,
// shadowOffsetY: 2,
// shadowOffsetX: 2,
},
tooltip: {
show: true,
},
data: weChat,
},
{
name: "音频",
type: "line",
smooth: true, //是否平滑
showAllSymbol: true,
// symbol: 'image://./static/images/guang-circle.png',
symbol: "circle",
symbolSize: 8,
lineStyle: {
normal: {
color: "#1381FF",
shadowColor: "rgba(0, 0, 0, .3)",
shadowBlur: 0,
shadowOffsetY: 5,
shadowOffsetX: 5,
},
},
itemStyle: {
color: "#1381FF",
// borderColor: "#fff",
borderWidth: 3,
shadowColor: "rgba(0, 0, 0, .5)",
shadowBlur: 6,
// shadowOffsetY: 2,
// shadowOffsetX: 2,
},
tooltip: {
show: true,
},
data: microblog,
},
],
}
myChart.setOption(option);
function createExample(option, tooltipOption) {
// 基于准备好的dom,初始化echarts图表
// 为echarts对象加载数据
myChart.setOption(option);
tools.loopShowTooltip(myChart, option, tooltipOption); //第一个参数需要改一下
}
createExample(option, {
loopSeries: true,
// 间隔时间
interval: 2000,
});
},
},
};
</script>
```
### 效果展示
