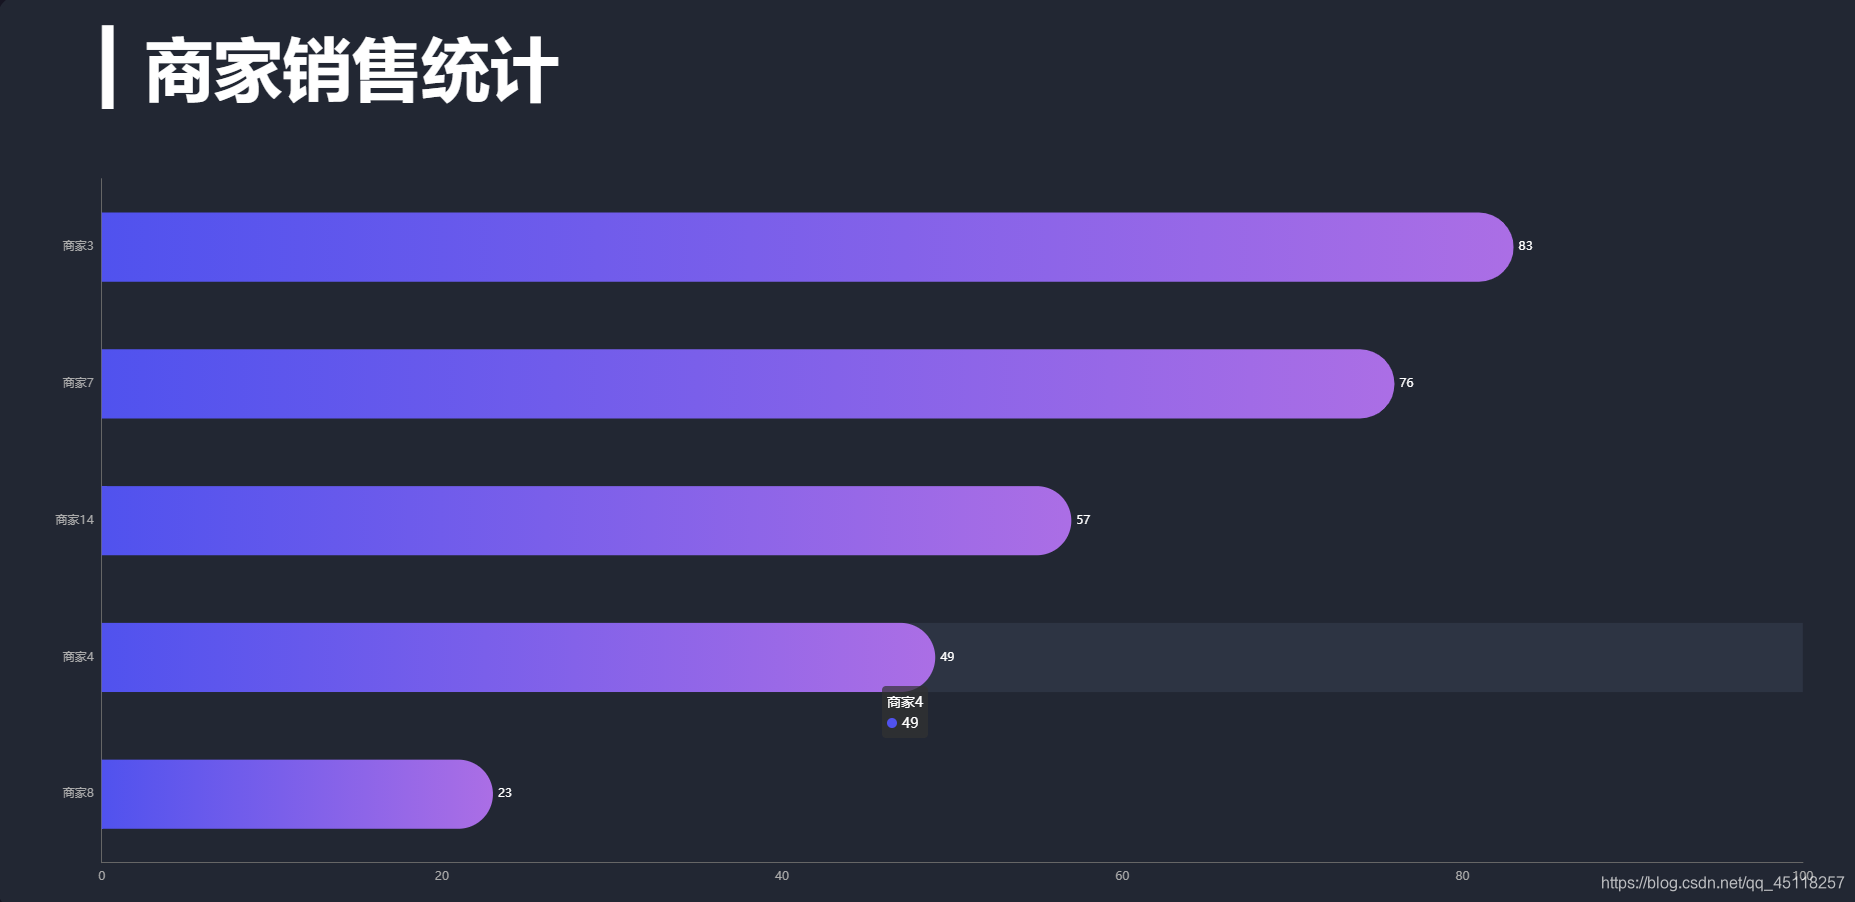
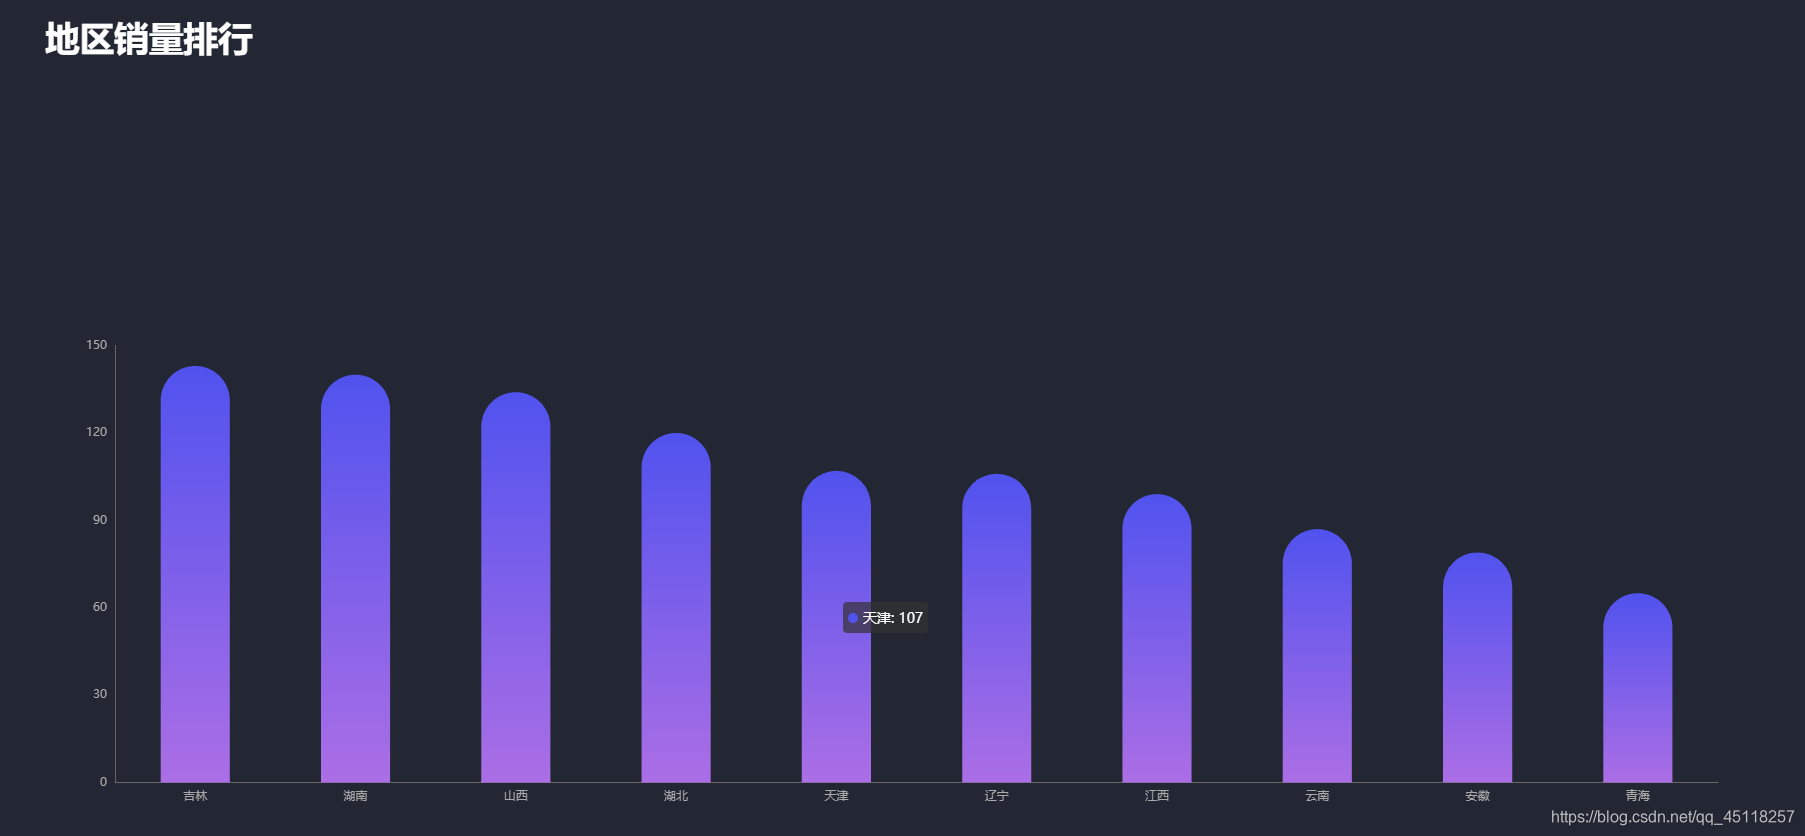
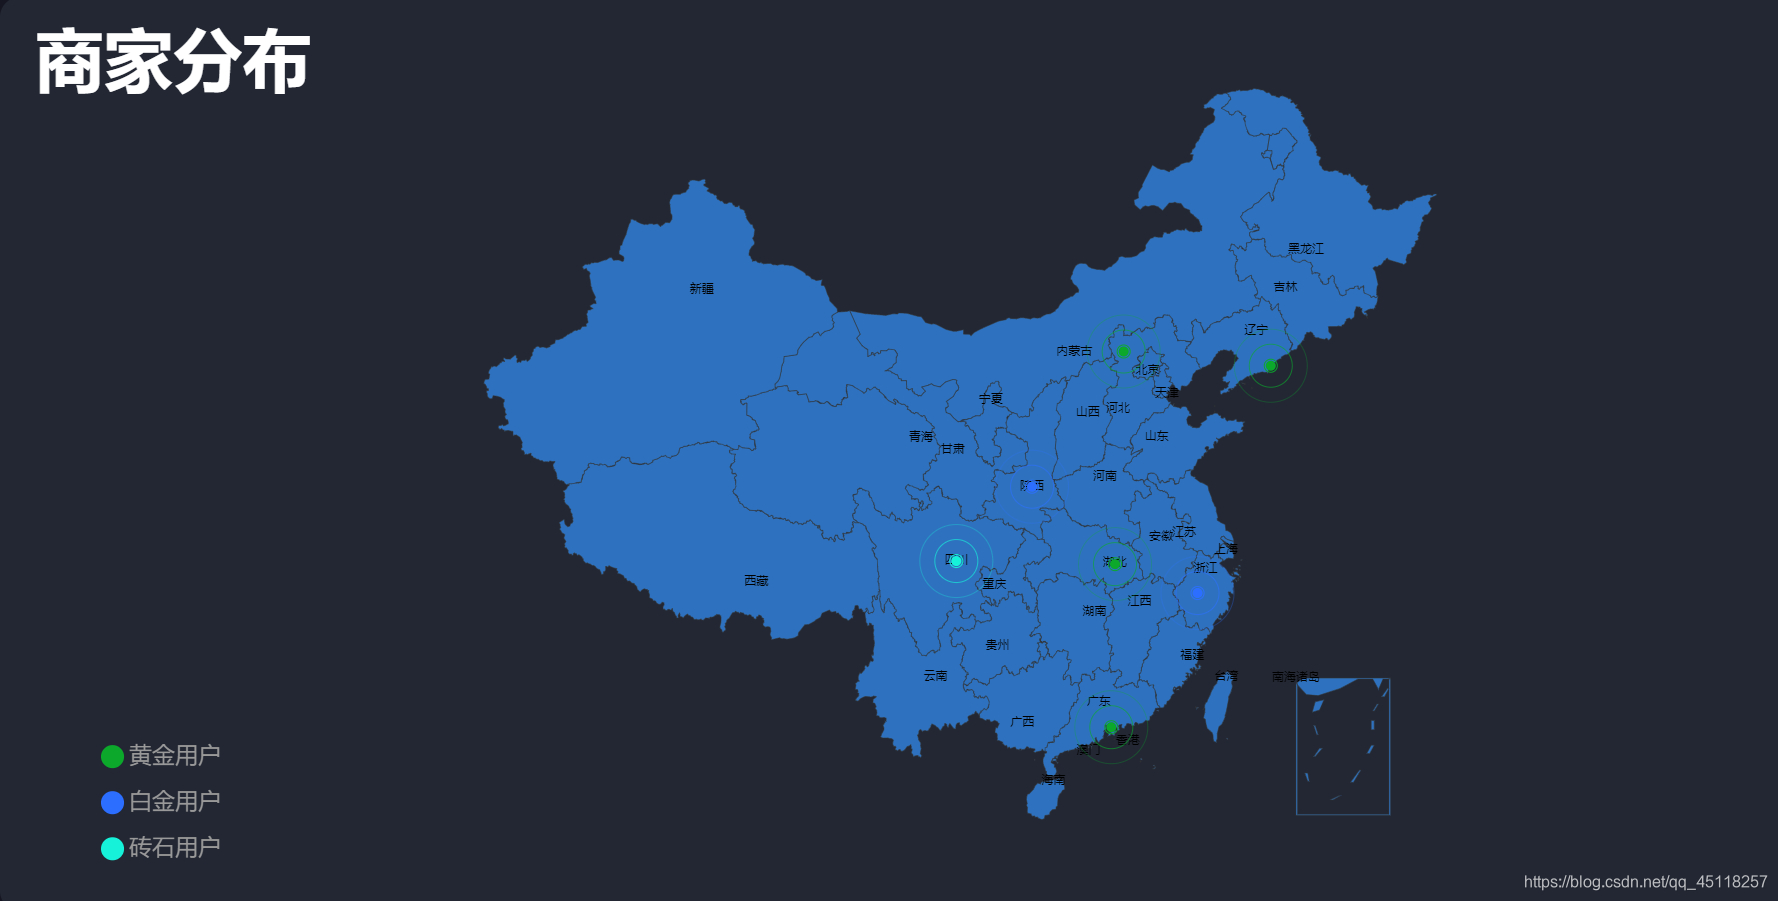
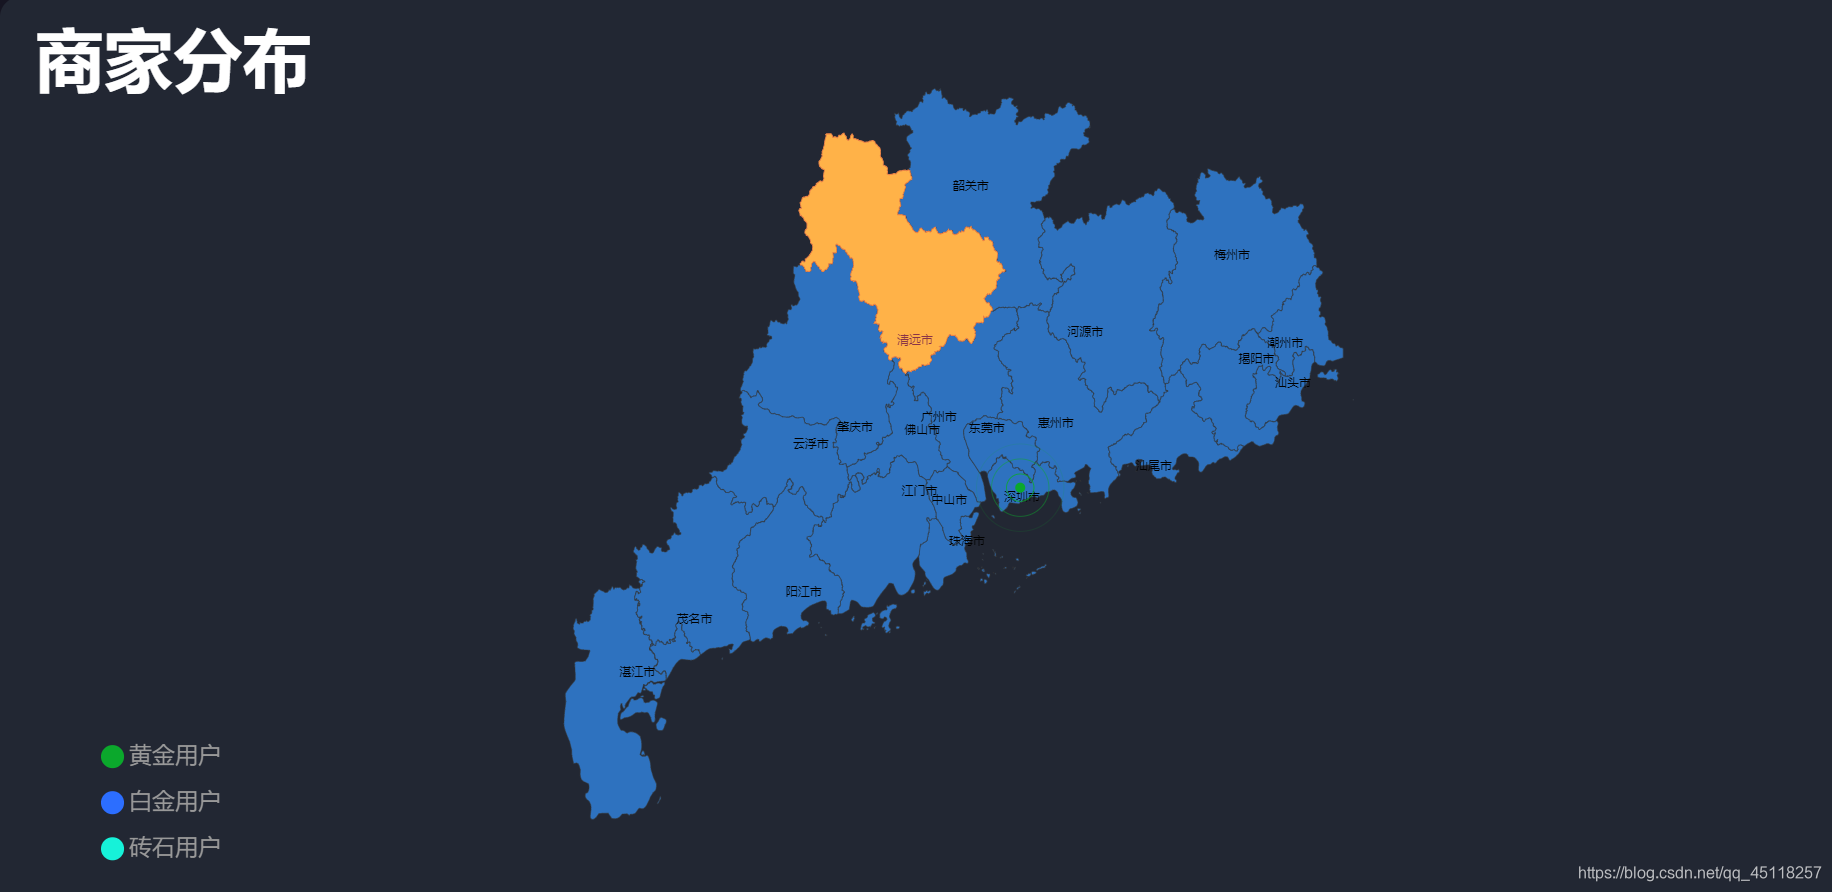
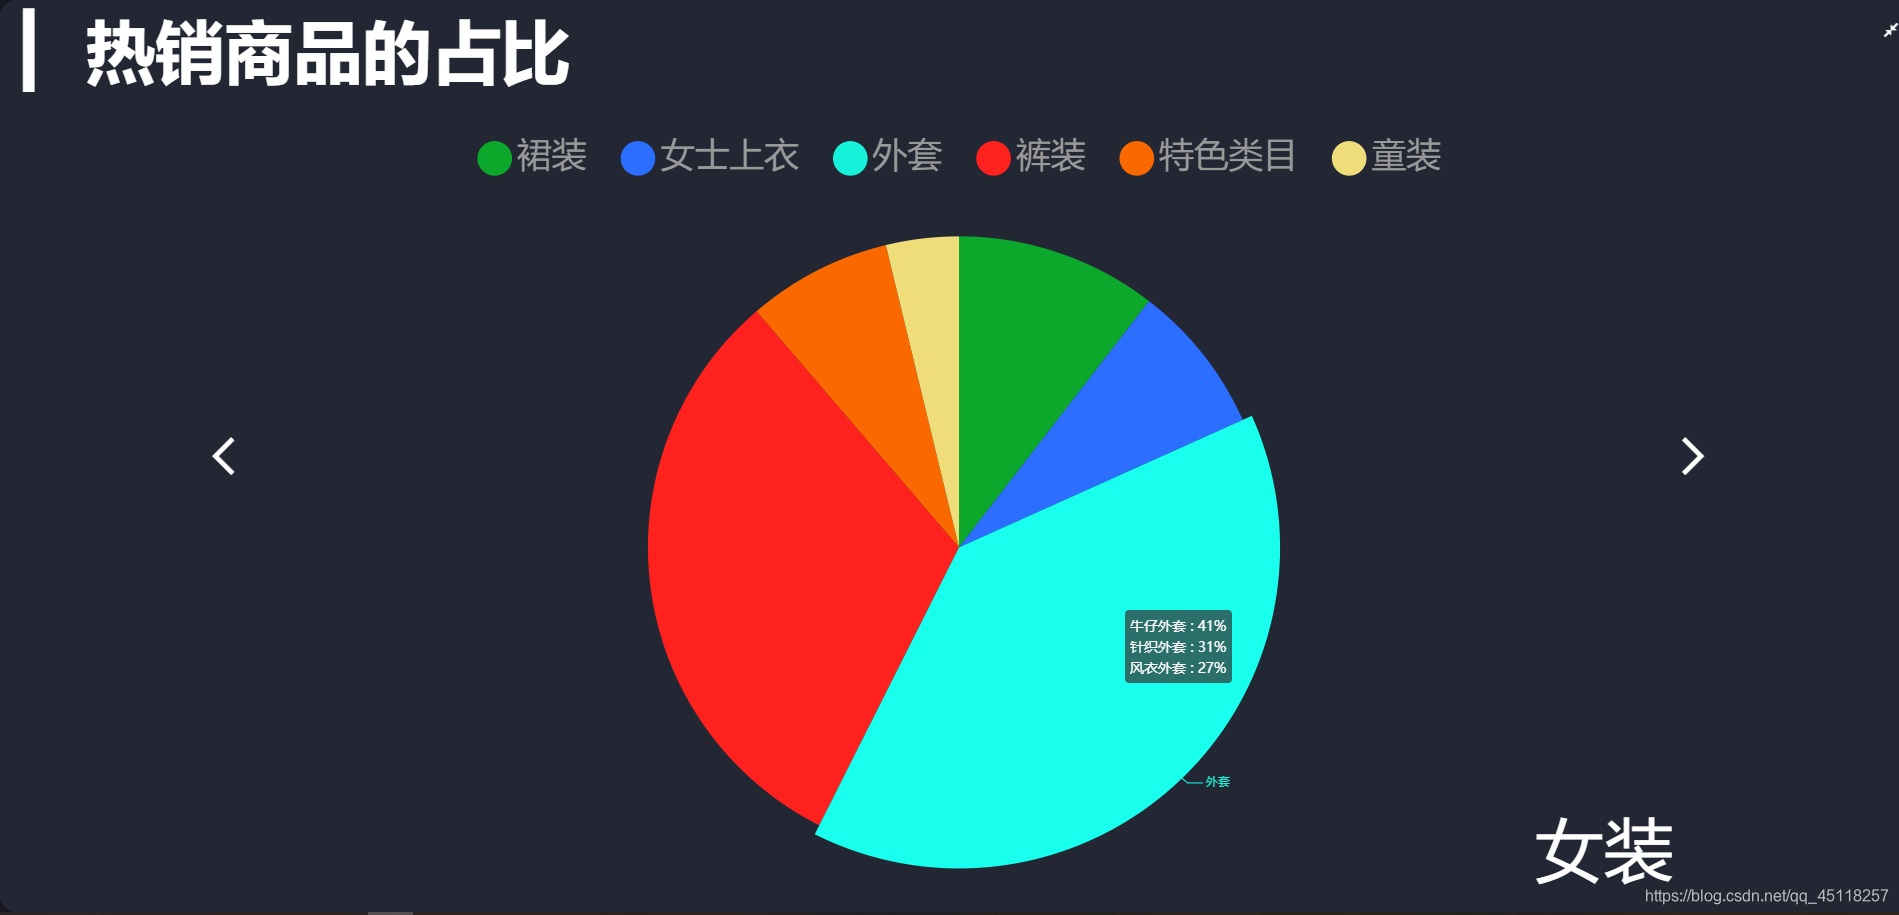
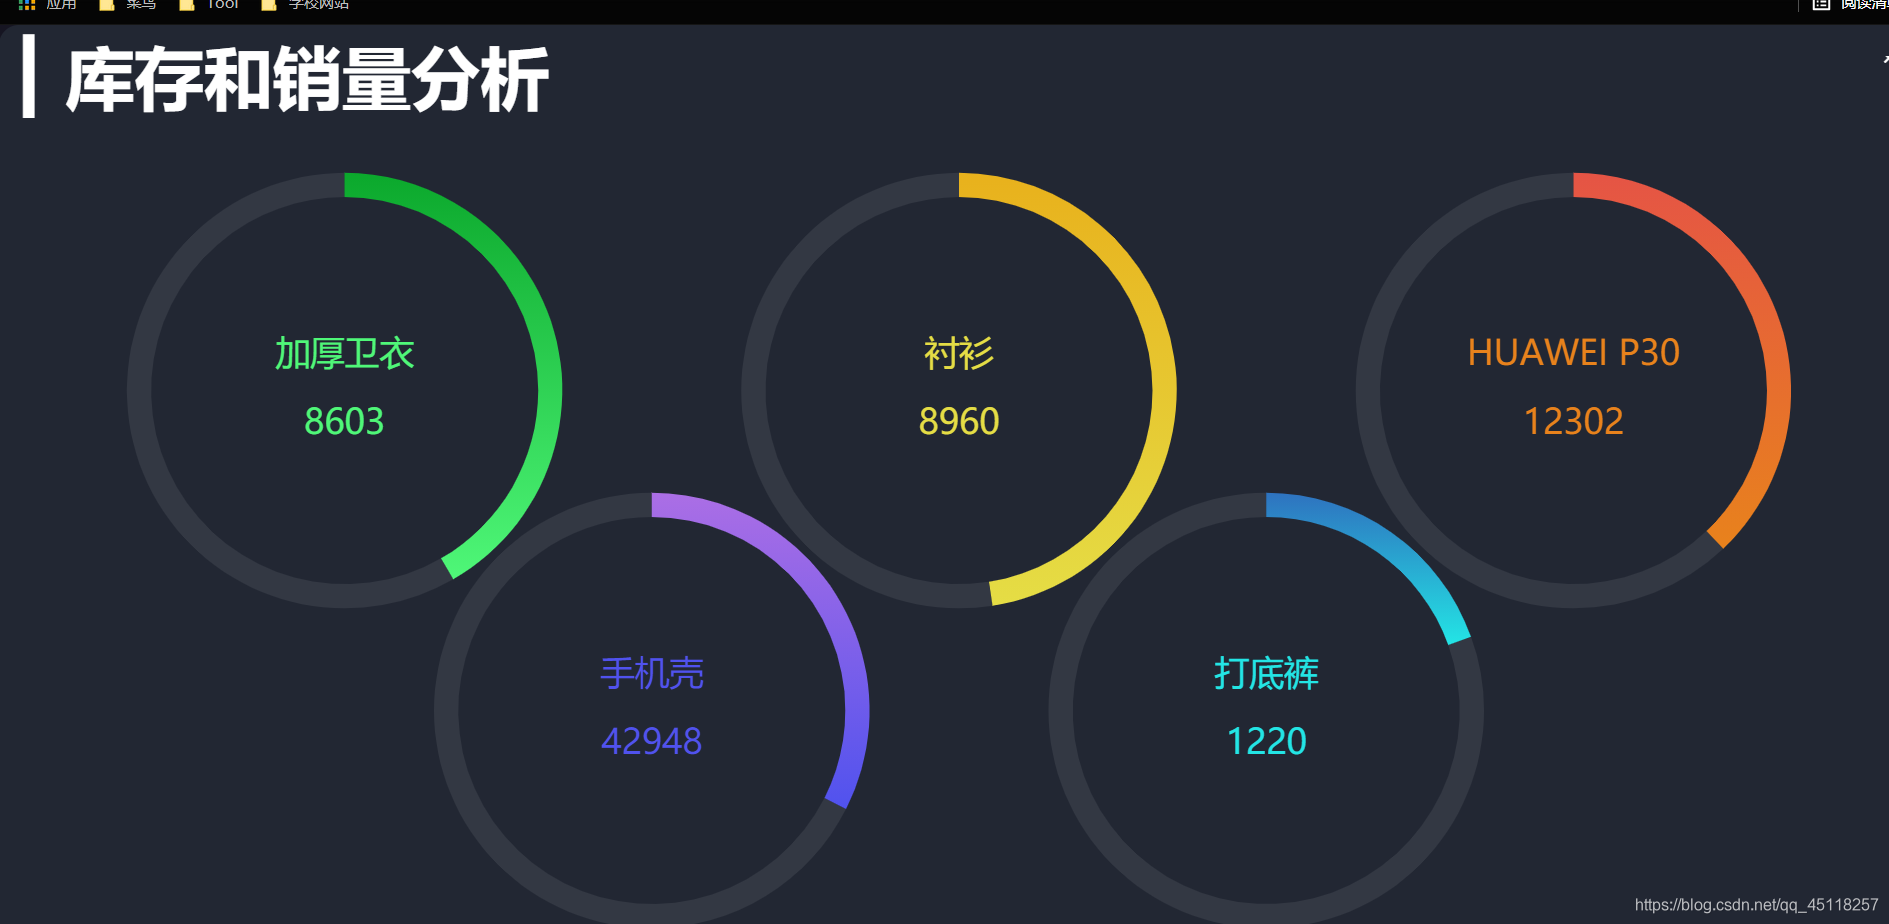
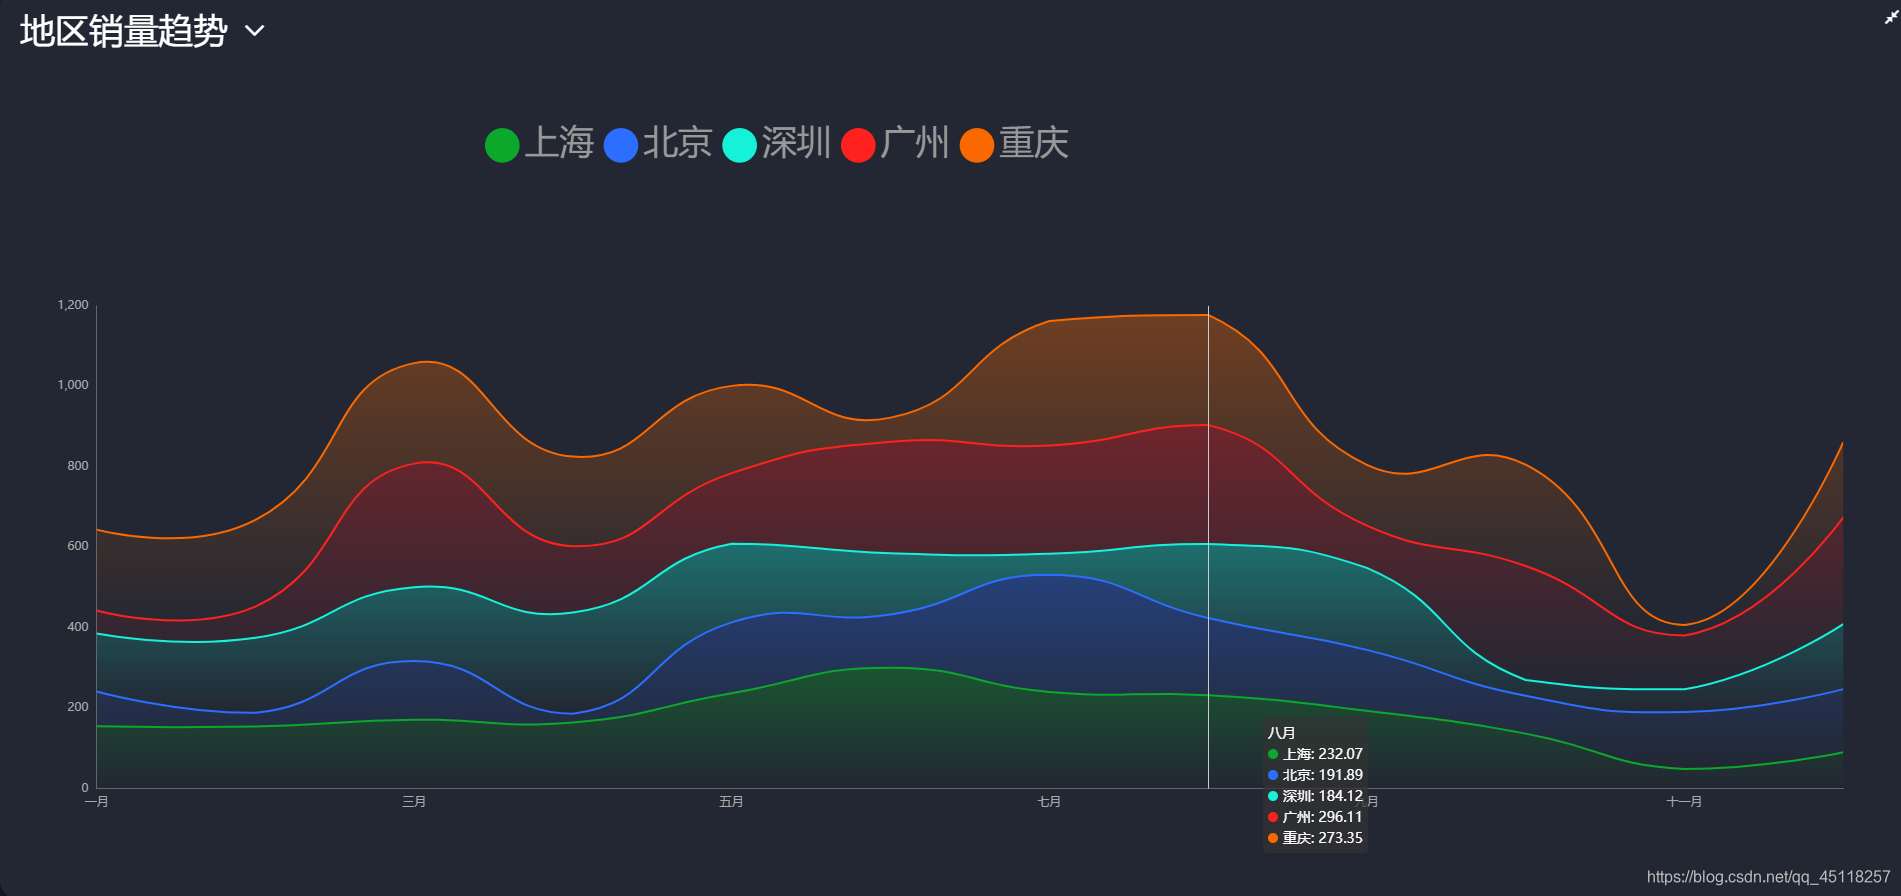
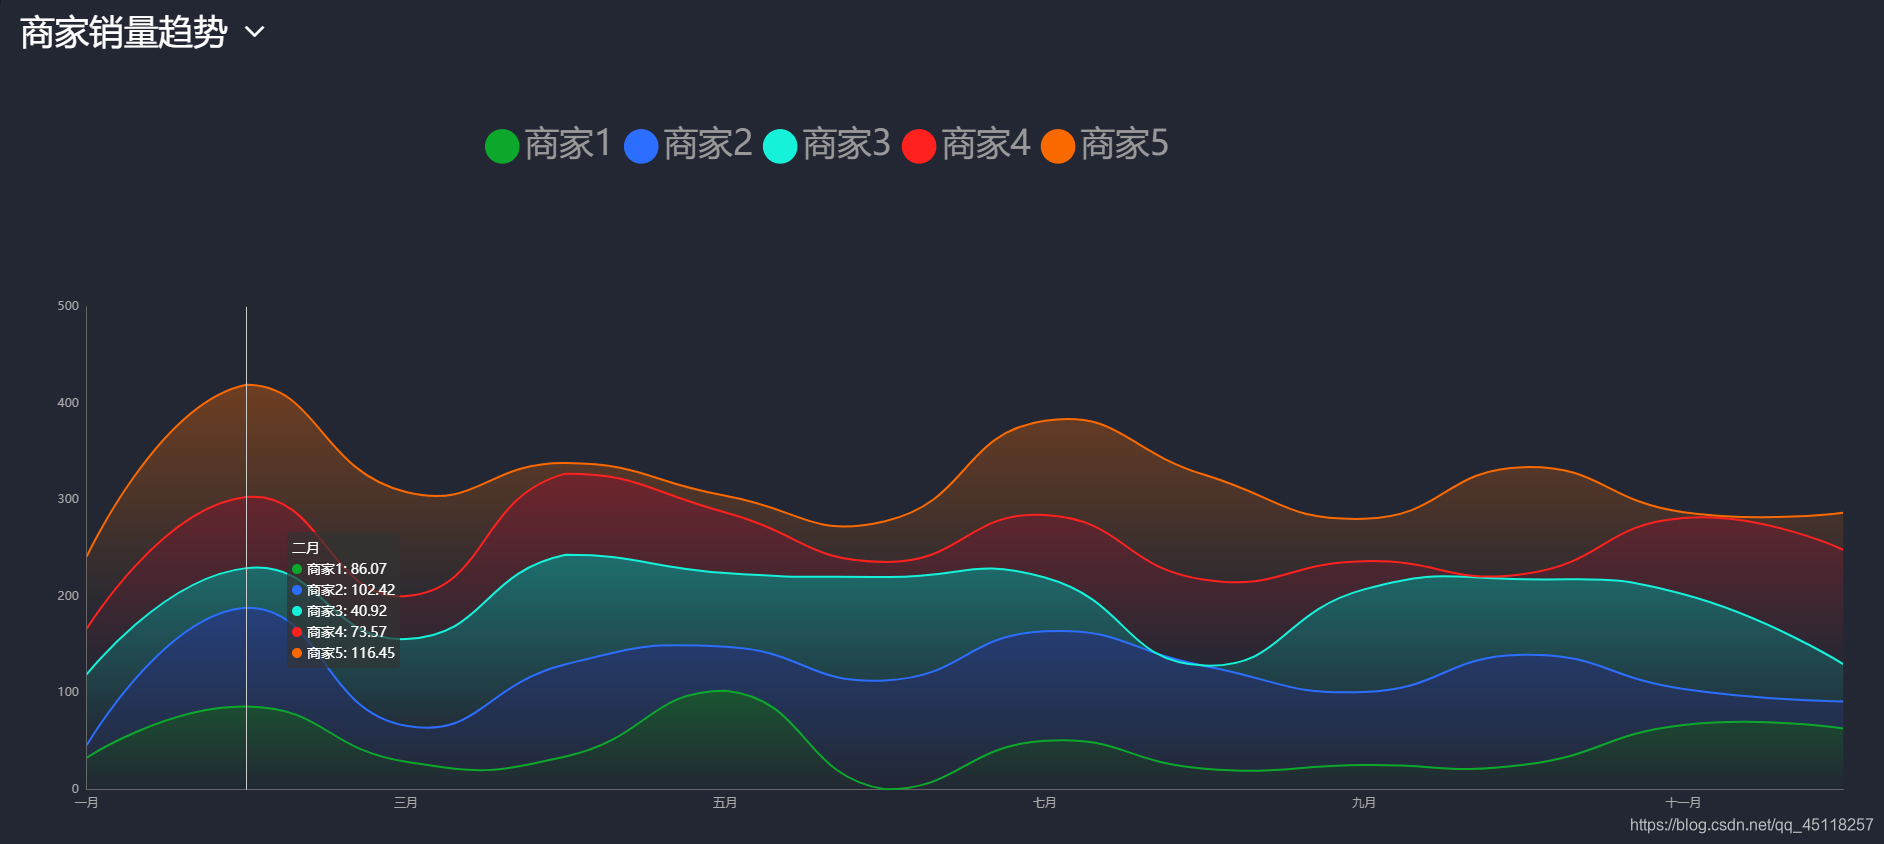
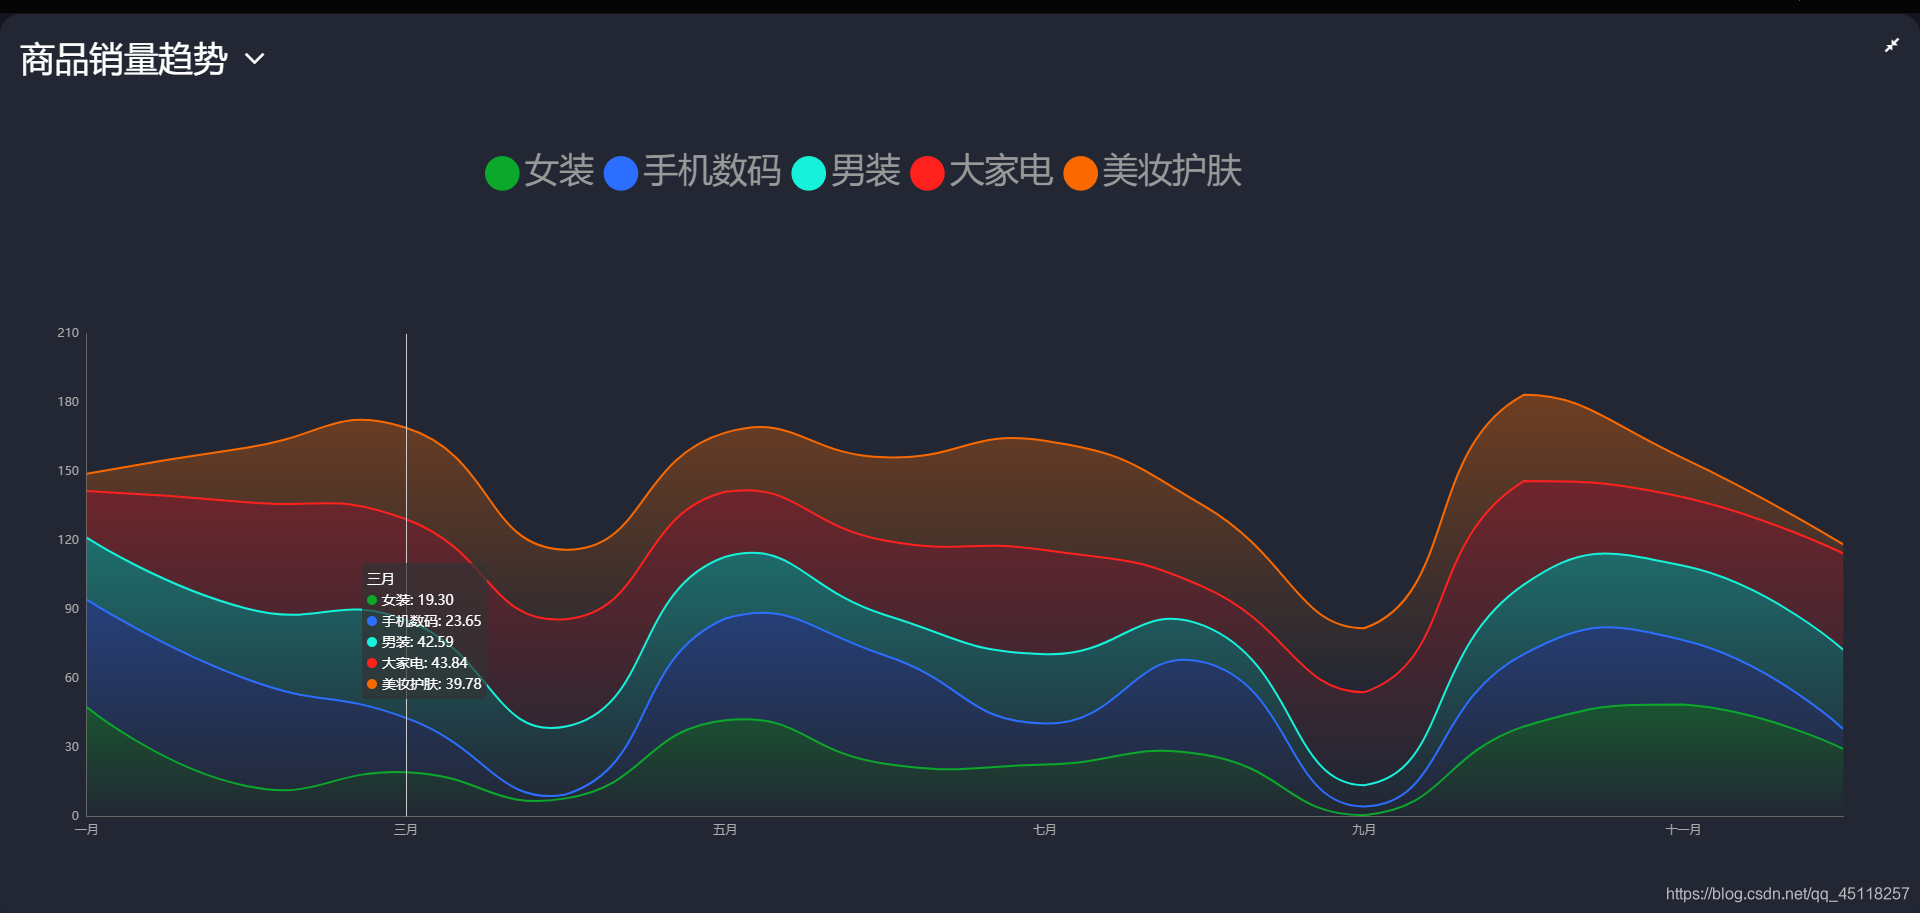
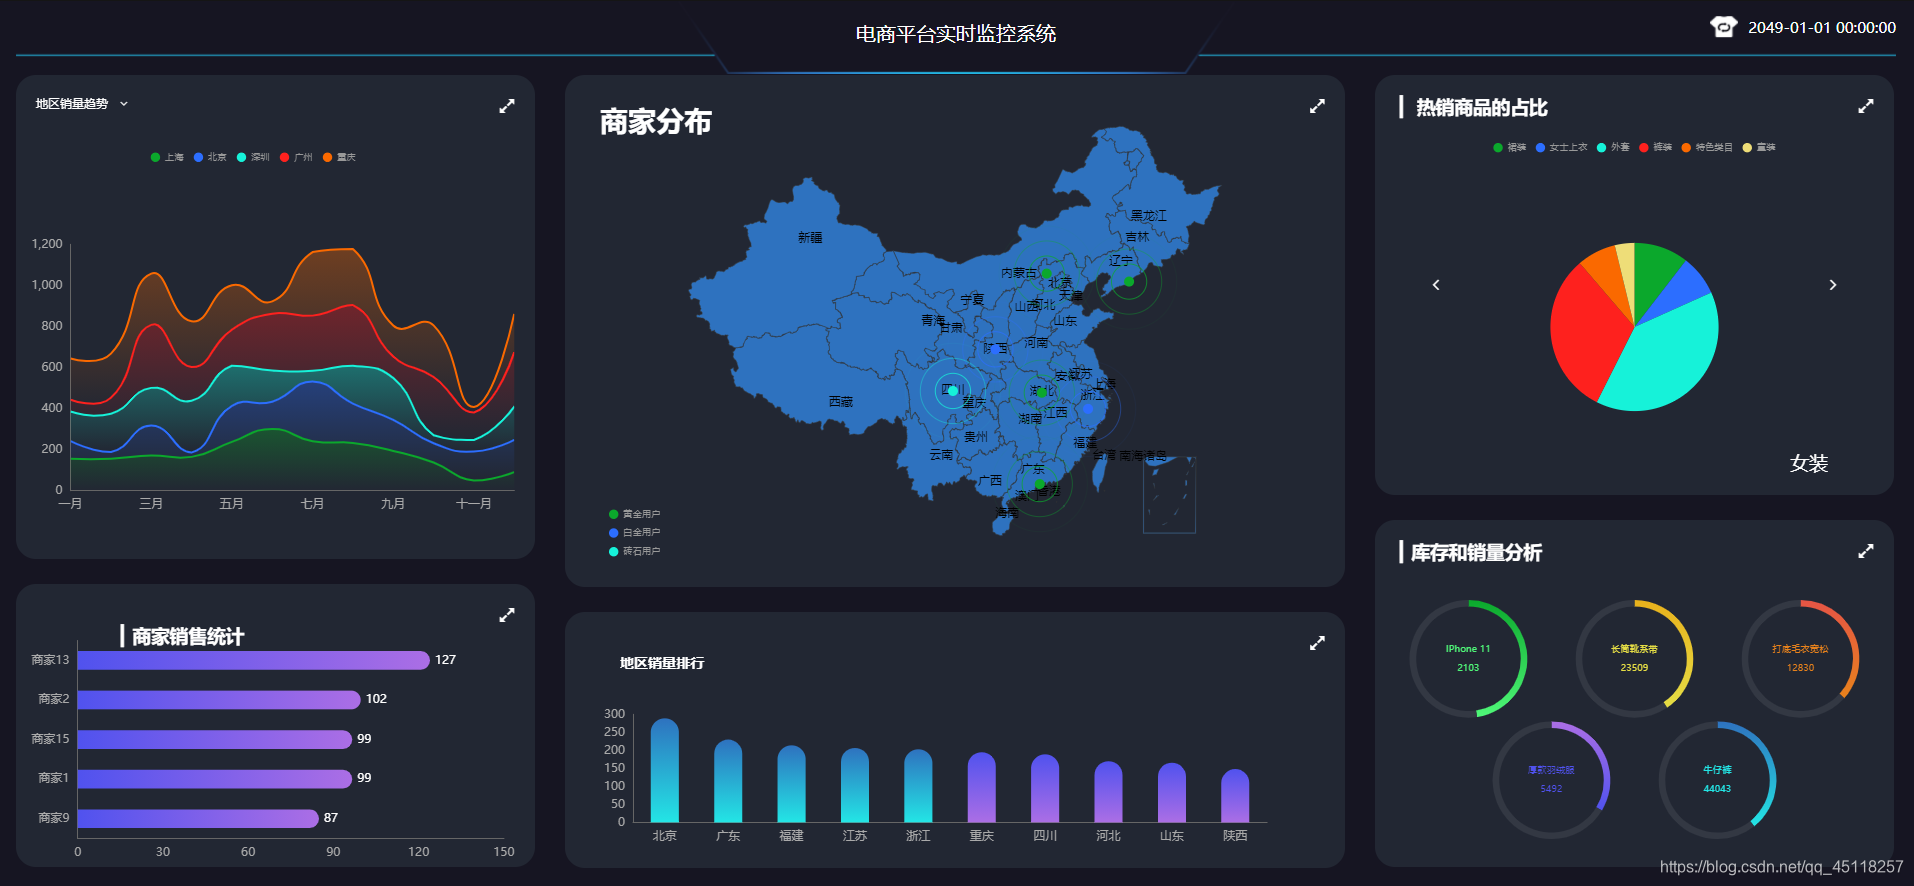
项目主要功能展示商家销售统计柱状图、地区销量排行柱状图、商家地图分布、热销商品占比饼图、 库存和销量分析、销量趋势折线图。通过Echarts插件来完成图表渲染。
项目基础代码
data(){
        return{
            chartInstance: null,//初始化init
            allData:null,
        }
    },
 mounted() {
        this.initChart()
        this.getData()
        //1.分辨率适配
        window.addEventListener('resize', this.screenAdapter)
        // 4.在页面加载完成的时候, 主动进行屏幕的适配
        this.screenAdapter()
    },
 initChart(){
            this.chartInstance = this.$echarts.init(this.$refs.seller_ref,this.theme)
            // 对图表初始化配置的控制
            const initOption = {}
             this.chartInstance.setOption(initOption)
}
 //获取服务器的数据
        async getData(){
            // 网络请求
            const {data:res} = await this.$http.get('url')

			this.updateChart()
        }
 //更新图表
        updateChart(){
			 //对原先的option进行拆分为dataOption、initOption(initChart方法中)、adapterOption(在screenAdapter方法中)
            const dataOption = { }
			 this.chartInstance.setOption(dataOption)

}
 // 2.当浏览器的大小发生变化的时候, 会调用的方法, 来完成屏幕的适配
        screenAdapter(){
            const titleFontSize = this.$refs.seller_ref.offsetWidth / 100 *3.6
            // 和分辨率大小相关的配置项
            const adapterOption = {}
             this.chartInstance.setOption(adapterOption)
            // 手动的调用图表对象的resize 才能产生效果
            this.chartInstance.resize()
        }
商家销售统计柱状图
将获得的商家销量按降序排序,每一页显示5条数据,两秒钟显示一页;
 //每一页显示五条数据
            this.totalPage = this.allData.length % 5 === 0 ? this.allData.length/5 : this.allData.length/5 + 1
  // 定时器
        startInterval(){
            if (this.timerId){
                //定时器存在就清除掉
                clearInterval(this.timerId)
            }
            this.timerId = setInterval(()=>{
                this.currentPage++
                if (this.currentPage > this.totalPage){
                    this.currentPage = 1
                }
                this.updateChart()
            },2000)
        },
地区销量排行柱状图
将获得的商家销量按降序排序,每隔两秒钟循环向左移一个;
- 对获取到的数据进行降序排序
 const {data:res} = await this.$http.get('rank')
            this.allData = res
            this.allData.sort((a,b)=>{
                return b.value - a.value
            })
//    定时器启动平移动画效果
        startInterval(){
            if (this.timerId){
                clearInterval(this.timerId)
            }
            //设置定时器
            this.timerId = setInterval(()=>{
               this.startValue++
                this.endValue++
                if(this.endValue > this.allData.length -1){
                    this.startValue = 0
                    this.endValue = 9
                }
                //更新视图
                this.updateChart()
            },2000)
        }
商家地图分布
结合散点图产生涟漪效果,点击省份进入省份地图,双击则返回中国地图;
- 在地图中配置散点图的涟漪效果
const seriesArr = this.allData.map(item=>{
                // return的这个对象就代表的是一个类别下的所有散点数据
                // 如果想在地图中显示散点的数据, 我们需要给散点的图表增加一个配置, coordinateSystem:geo
                return {
                    //散点图
                    type:'effectScatter',
                    data:item.children,
                    name:item.name,
                    coordinateSystem:'geo',
                //    产生涟漪效果
                    rippleEffect: {
                        scale: 10,
                        brushType: 'stroke'
                    },
                }
            })
- 省份详细情况
点击某个省份显示该省份的县市情况
//    获取地图的点击事件
            this.chartInstance.on('click',async arg=>{
                //1.将省份中文名称转变为拼音
                // arg.name 得到所点击的省份, 这个省份他是中文
               const provinceInfo = getProvinceMapInfo(arg.name)
                //2. 需要获取这个省份的地图矢量数据
                // 判断当前所点击的这个省份的地图矢量数据在mapData中是否存在
                if (!this.allData[provinceInfo.key]){
                    const res = await axios.get('http://localhost:8080' + provinceInfo.path)
                    this.provinceMap[provinceInfo.key] = res.data
                //    地图注册
                    this.$echarts.registerMap(provinceInfo.key,res.data)
                }
                const changeOption = {
                    geo: {
                        map: provinceInfo.key
                    }
                }
                this.chartInstance.setOption(changeOption)

            })
 //双击回到中国地图
        revertMap(){
            const revertOption ={
                geo:{
                    map:'china'
                }
            }
            this.chartInstance.setOption(revertOption)
        }
热销商品占比饼图
左右箭头可切换一级分类饼图,鼠标经过饼图显示三级分类名称及其占比;
//    数据处理
            const seriesArr = this.allData[this.currentIndex].children.map(item=>{
                return{
                    value:item.value,
                    name:item.name,
                    //这里添加children属性,是为了tooltip用到,三级分类的有关数据
                    children:item.children
                }
            })
            const legendArr = this.allData[this.currentIndex].children.map(item=>item.name)
- 切换一级分类
 //点击左键切换分类
        toLeft(){
            this.currentIndex--
            if (this.currentIndex < 0){
                this.currentIndex = this.allData.length - 1
            }
            //更换视图
            this.updateChart()
        },
        //点击右键切换分类
        toRight(){
            this.currentIndex++
            if(this.currentIndex > this.allData.length - 1){
                this.currentIndex = 0
            }
            //更换视图
            this.updateChart()
        }
    }
- 鼠标经过显示三级分类的商品名称和占百分比
 tooltip:{
                    show:true,
                    //鼠标经过显示三级分类的名称和占百分比
                    formatter:arg =>{
                        // console.log(arg)
                        const ThreeChildren = arg.data.children
                    //      // 计算出所有三级分类的数值总和
                        let total = 0
                        ThreeChildren.forEach(item=>{
                            return total += item.value
                        })

                    //    显示三级分类的数据,三级分类的名称:占百分比
                        // eslint-disable-next-line no-unused-vars
                        let result = ''
                        ThreeChildren.forEach(item=>{
                            //三级分类的名称:占百分比
                            result += `${item.name} : ${parseInt(item.value / total * 100)+'%'}<br/>`
                        })
                        return result
                    }

                },
库存和销量分析
显示库存和销量的圆环图
- 内外半径
 series: [
                    {
                        type: 'pie',
                        //内外圆环的设置
                        radius: [outterRadius, innerRadius],
                        label: {
                            fontSize: titleFontSize / 2
                        }
                    },
- 每个三秒钟刷新一次视图
 //    定时器,
        startInterval(){
            if (this.timerId){
               clearInterval(this.timerId)
            }
            this.timerId = setInterval(()=>{
                this.currentIndex++
                if (this.currentIndex > 1){
                    this.currentIndex = 0
                }
                this.updateChart()
            },3000)
        }
    }
//    数据处理
            const start = this.currentIndex*5
            const end = (this.currentIndex + 1) * 5
            const showData = this.allData.slice(start,end)
            const seriesArr = showData.map((item,index)=>{
                return{
                    type:'pie',
                    center:centerArr[index],
                    hoverAnimation: false, // 关闭鼠标移入到饼图时的动画效果
                    labelLine: {
                        show: false // 隐藏指示线
                    },
                    label:{
                    //    设置圆环中的文字
                        position:'center',
                        color:colorArr[index][0]

                    },
                    data:[
                        {
                            name:item.name + '\n\n' + item.sales,
                            value:item.sales,
                            itemStyle: {
                                color: new this.$echarts.graphic.LinearGradient(0, 1, 0, 0,[
                                    {
                                        offset:0,
                                        color:colorArr[index][0]
                                    },
                                    {
                                        offset:1,
                                        color:colorArr[index][1]
                                    }
                                ])
                            }
                        },
                        {
                            value:item.stock,
                            itemStyle: {
                                color: '#333843'
                            }
                        }

                    ]

                }
            })
销量趋势折线图
下拉框可选择销量趋势分类
- 下拉框
<div class="com-container">
<div class="title" :style="comStyle">
<span>{{showTitle}}</span>
<span class="iconfont title-icon" :style="comStyle" @click="showChoice = !showChoice"></span>
<div class="select-con" :style="comStyle" v-show="showChoice">
<div class="select-item"
v-for="item in selectType"
:key="item.key"
@click="handleSelect(item.key)"
>{{item.text}}</div>
</div>
</div>
<div class="com-chart" ref="trend_ref"></div>
</div>
computed:{
        ...mapState(['theme']),
        //    选择的类型
        selectType(){
            if (!this.allData){
                return  []
            }
            return this.allData.type.filter(item=>{
                //过滤掉选择过的选项
                return item.key !== this.choiceType
            })
        },

        //    显示选项标题
        showTitle(){
            if (!this.allData){
                return ''
            }
            return this.allData[this.choiceType].title
        },

        //    标题自适应大小
        // 设置给标题的样式
        comStyle () {
            return {
                fontSize: this.titleFontSize / 2 + 'px',
                color:getThemeValue(this.theme).titleColor
            }
        },
    },
   //   点击选项展示对应选项的数据
        handleSelect(currentChartType){
           this.choiceType = currentChartType
            this.updateChart()
            this.showChoice = false
        }
总结
这个项目就是为了对Echarts这个插件更加的熟悉,Echarts的配置,数据渲染等操作项目中也多处体现。
- Echars的使用分为三个步骤this.$echarts.init()初始化echarts实例,option指定图表的配置项和数据,steOption()使用option显示图表。
- option分为三个部分,分别为initOption图表初始化配置,dataOption图表数据的配置,adapterOption 图表分辨率相关配置。
