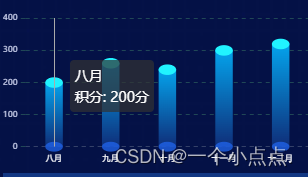
一、效果图
自动从一月开始向左滚动至十二月再跳转至一月循环滚动。
二、主要代码
var timer = null;
// 自动滚动
dataZoom: [//滑动条
{
show: false,//是否显示滑动条
type: 'slider', // 这个 dataZoom 组件是 slider 型 dataZoom 组件
startValue: 0, // 从头开始。
endValue: 4 // 一次性展示5个。
}
],
// 使用刚指定的配置项和数据显示图表。
timer = setInterval(function () {
// 每次向后滚动一个,最后一个从头开始;
// SData.length - 1 为数组的长度,索引从0开始,所以长度减一;
if (option1.dataZoom[0].endValue == SData.length - 1) {
option1.dataZoom[0].endValue = 4;
option1.dataZoom[0].startValue = 0;
}
else {
option1.dataZoom[0].endValue = option1.dataZoom[0].endValue + 1;
option1.dataZoom[0].startValue = option1.dataZoom[0].startValue + 1;
}
myChart1.setOption(option1,true); // 这条不能省略;
}, 2000);
三、完整代码
var timer = null;
// 基于准备好的dom,初始化echarts实例
var myChart1 = echarts.init(document.getElementById('chart1'));
var SData = [200, 330, 300, 280, 350, 290, 180, 200, 260, 240, 300, 320];
myChart1.clear();
clearInterval(timer);

// 指定图表的配置项和数据
var option1 = {
  // 设置图表的位置
  grid: {
    x: 0, // 左间距
    y: 30, // 上间距
    x2: 0, // 右间距
    y2: 10, // 下间距
    containLabel: true // grid 区域是否包含坐标轴的刻度标签, 常用于『防止标签溢出』的场景
  },

  // dataZoom 组件 用于区域缩放
  dataZoom: [
    {
      type: 'inside',
      xAxisIndex: [0], // 设置 dataZoom-inside 组件控制的 x轴
      // 数据窗口范围的起始和结束百分比  范围: 0 ~ 100
      start: 0,
      end: 100
    }
  ],
  // 提示框组件
  tooltip: {
    trigger: 'axis', // 触发类型, axis: 坐标轴触发
    axisPointer: {
      type: 'line' // 指示器类型
    },
    textStyle: {
      color: '#fff' // 文字颜色
    },
    // 提示框浮层内容格式器,支持字符串模板和回调函数两种形式
    // 折线(区域)图、柱状(条形)图、K线图 : {a}(系列名称),{b}(类目值),{c}(数值), {d}(无)
    formatter: '{b}<br />{a0}: {c0}分'
  },
  // X轴
  xAxis: {
    show: true, // 不设置默认值为 true
    type: 'category', // 坐标轴类型,  'category' 类目轴,适用于离散的类目数据,为该类型时必须通过 data 设置类目数据
    // 坐标轴轴线
    axisLine: {
      lineStyle: {
        type: 'dashed', // 坐标轴线线的类型 'solid', 'dashed', 'dotted'
        width: 1, // 坐标轴线线宽, 不设置默认值为 1
        color: '#354069' // 坐标轴线线的颜色
      }
    },
    // 坐标轴刻度
    axisTick: {
      show: false
    },
    // 分隔线
    splitLine: {
      show: false
    },
    // 坐标轴刻度标签
    axisLabel: {
      fontSize: fontSize(.12), // 文字的字体大小
      color: '#fff', // 刻度标签文字的颜色
    },
    // 类目数据,在类目轴(type: 'category')中有效
    data: ['一月', '二月', '三月', '四月', '五月', '六月', '七月', '八月', '九月', '十月', '十一月', '十二月']
  },
  // 左侧Y轴
  yAxis: [
    {
      type: 'value', // 坐标轴类型,   'value' 数值轴,适用于连续数据
      // name: '(万)', // 坐标轴名称
      nameLocation: 'end', // 坐标轴名称显示位置 'start', 'middle' 或者 'center', 'end'
      nameTextStyle: { // 坐标轴名称的文字样式
        color: '#fff',
        fontSize: fontSize(.12)
      },
      // y轴数值间隔
      min: 0,
      max: 400,
      splitNumber: 4,
      nameGap: 20, // 坐标轴名称与轴线之间的距离
      // 坐标轴刻度
      axisTick: {
        show: true // 是否显示坐标轴刻度 默认显示
      },
      // 坐标轴轴线
      axisLine: { // 是否显示坐标轴轴线 默认显示
        show: false, // 是否显示坐标轴轴线 默认显示
        lineStyle: { // 坐标轴线线的颜色
          color: '#204756'
        }
      },
      // 坐标轴在 grid 区域中的分隔线
      splitLine: {
        show: true, // 是否显示分隔线,默认数值轴显示
        lineStyle: {
          type: 'dashed',
          color: '#204756', // 分隔线颜色
          opacity: 1 // 分隔线透明度
        }
      },
      // 坐标轴刻度标签
      axisLabel: {
        show: true, // 是否显示刻度标签 默认显示
        fontSize: fontSize(.12), // 文字的字体大小
        color: '#cdd3ee', // 刻度标签文字的颜色
        // 使用字符串模板,模板变量为刻度默认标签 {value}
        formatter: '{value}'
      }
    }
  ],
  // 自动滚动
  dataZoom: [//滑动条
    {
      show: false,//是否显示滑动条
      type: 'slider', // 这个 dataZoom 组件是 slider 型 dataZoom 组件
      startValue: 0, // 从头开始。
      endValue: 4  // 一次性展示5个。
    }
  ],
  // 系列列表
  series: [
    // 柱状图顶部的圆片
    {
      name: "积分", // 系列名称, 用于tooltip的显示, legend 的图例筛选
      type: "pictorialBar", // 系列类型
      symbolSize: [fontSize(.25), fontSize(.15)], // 标记的大小
      symbolOffset: [0, -5], // 标记相对于原本位置的偏移
      symbolPosition: "end", // 图形的定位位置。可取值:start、end、center
      // 图例的图形样式
      itemStyle: {
        color: {
          type: 'linear',
          x: 0,
          y: 0,
          x2: 0,
          y2: 1,
          colorStops: [{
            offset: 0,
            color: '#21F3FF' // 0% 处的颜色
          }, {
            offset: 1,
            color: '#21F3FF' // 100% 处的颜色
          }]
        }
      },
      z: 10, // 组件的所有图形的z值。控制图形的前后顺序。z值小的图形会被z值大的图形覆盖
      data: SData  // 系列中的数据内容数组
    },
    // 柱状图
    {
      name: '积分', // 系列名称, 用于tooltip的显示, legend 的图例筛选
      type: 'bar', // 系列类型
      barWidth: fontSize(.25), // 指定柱宽度,可以使用绝对数值或百分比,默认自适应
      barGap: '-100%', // 不同系列的柱间距离l,如果想要两个系列的柱子重叠,可以设置 barGap 为 '-100%'。这在用柱子做背景的时候有用
      // 图例的图形样式
      itemStyle: {
        color: {
          type: 'linear',
          x: 0,
          y: 0,
          x2: 0,
          y2: 1,
          colorStops: [{
            offset: 0,
            color: '#04a3ec' // 0% 处的颜色
          }, {
            offset: 1,
            color: '#0f2e79' // 100% 处的颜色
          }]
        }
      },
      data: SData // 系列中的数据内容数组
    },

    // 柱状图底下的圆片
    {
      name: "积分",
      type: "pictorialBar", // 系列类型
      symbolSize: [fontSize(.25), fontSize(.14)], // 标记的大小
      symbolOffset: [0, 5], // 标记相对于原本位置的偏移
      // 图例的图形样式
      itemStyle: {
        color: {
          type: 'linear',
          x: 0,
          y: 0,
          x2: 0,
          y2: 1,
          colorStops: [{
            offset: 0,
            color: '#1f63eac7' // 0% 处的颜色
          }, {
            offset: 1,
            color: '#1f63eac7' // 100% 处的颜色
          }]
        }
      },
      z: 10, // 组件的所有图形的z值。控制图形的前后顺序。z值小的图形会被z值大的图形覆盖
      data: [1, 1, 1, 1, 1, 1, 1, 1, 1, 1, 1, 1] // 系列中的数据内容数组
    },

  ],

};

// 使用刚指定的配置项和数据显示图表。
timer = setInterval(function () {
  // 每次向后滚动一个,最后一个从头开始。
  if (option1.dataZoom[0].endValue == SData.length - 1) {
    option1.dataZoom[0].endValue = 4;
    option1.dataZoom[0].startValue = 0;
  }
  else {
    option1.dataZoom[0].endValue = option1.dataZoom[0].endValue + 1;
    option1.dataZoom[0].startValue = option1.dataZoom[0].startValue + 1;
  }
  myChart1.setOption(option1,true);
}, 2000);


myChart1.clear();
myChart1.setOption(option1,true);
// 监听屏幕变化自动缩放图表
window.addEventListener("resize", function () {
  myChart1.resize();
});
~~~
