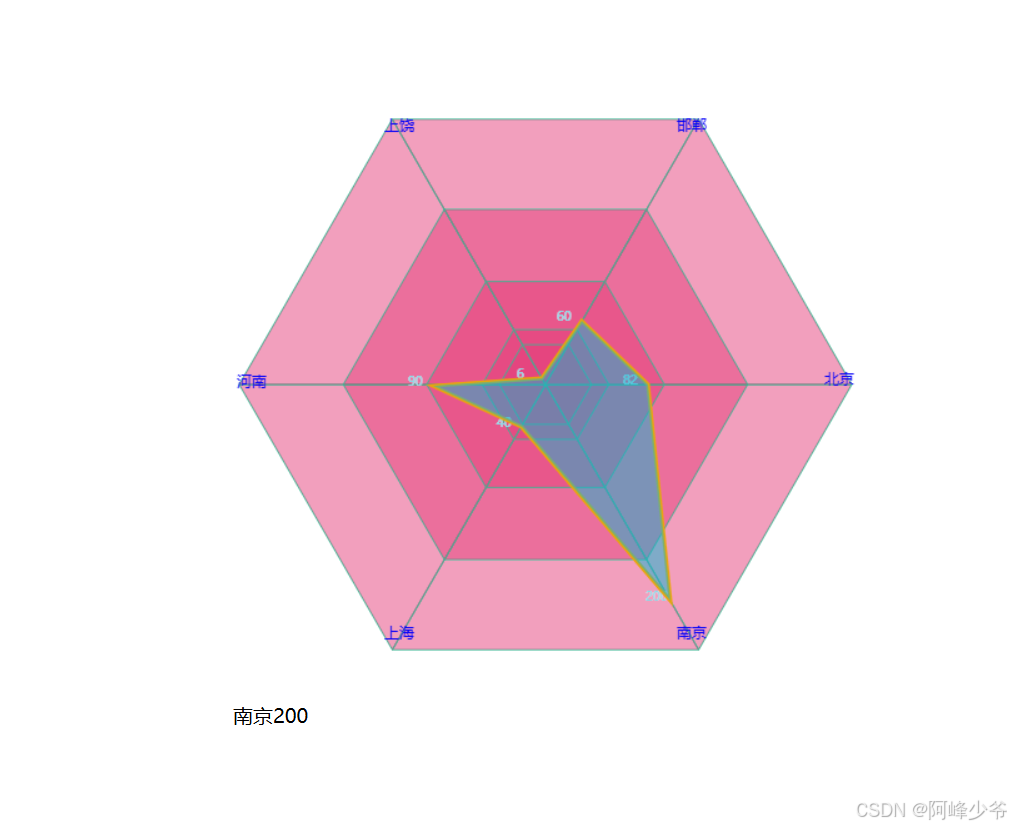
今天正好有时间,之前的工作中接到前端的设计图中有个雷达图,但因为是内网,导入echarts框架比较困难,所以当时就直接自己用canvas手敲了个雷达图。这是第一版,样式可能比较差点。最终版的样式代码我这里没有了。
发这篇文章的目的主要有两种:第一种是为自己做一个小笔记,第二种是为刚学习canvas的朋友们提供一个可以参考的素材吧
创建一个dom元素
供绘制的图形显示
		<div id="canvasCircle">
		    <canvas id="canvas"></canvas>
		    <span id="text">城市</span>
		</div>
简单编写下css样式
		#canvasCircle{
		    width: 500px;
			height: 500px;
			position: absolute;
			top: 100px;
			left: 40%;
			z-index: 10;
		}
最重要的来了...
不过在这之前首先说下实例中用到的几个知识点
Math.abs(result) : 获取整数的绝对值
Math.ceil(result) :向上取值,如:1.2 结果是 2
Math.PI :约为90度
Math.atan(tan) : 获取反正切值
Math.round(result) : 将一个数字四舍五入为最接近的值,1.2 =1,-1.2=-1,-1.8=-2
isPointInPath:这是canvas提供的方法,主要用来探测画布中的图像是否在自己点击范围内
编写JavaScript逻辑
draw()
function draw(){
	var canvasCircle = document.getElementById("canvasCircle")
	var width = parseInt(getComputedStyle(canvasCircle,null).width)
	var height = parseInt(getComputedStyle(canvasCircle,null).height)
	var canvas = document.getElementById("canvas");
	var ctx = canvas.getContext("2d");
	var ctx1 = canvas.getContext("2d");
	let isMove = false;
//  支撑图像的数据
	let cityData = [
		{
			name:"北京",
			number:"82"
		},
		{
			name:"南京",
			number:"200"
		},
		{
			name:"上海",
			number:"40"
		},
		{
			name:"河南",
			number:"90"
		},
		{
			name:"上饶",
			number:"6"
		},
		{
			name:"邯郸",
			number:"60"
		}]
// 旋转的角度
	let rotation = Math.PI*2/cityData.length;
	let total = cityData.length;
	canvas.width = width;
	canvas.height = height;
	let center = canvas.width/2;
//  绘制canvas的背景图
	function background(rotation,cityData,LinebgColor){
		ctx.save();
		ctx.lineWidth = "1";
		let rad = 5;
		let radius = width;
		let lineColor = "#23C695";
		let bgColor = "rgba(230,63,123,0.5)";
		arcDraw(rotation,rad,total,(radius / 2),bgColor,lineColor)
		arcDraw(rotation,rad,total,(radius / 3),bgColor,lineColor)
		arcDraw(rotation,rad,total,(radius / 5),bgColor,lineColor)
		arcDraw(rotation,rad,total,(radius / 9),bgColor,lineColor)
		arcDraw(rotation,rad,total,(radius / 12),bgColor,lineColor)
		drawcity(rotation,rad,total,width,cityData);
		drawLine(cityData,ctx1,rotation,LinebgColor);
		ctx.restore();
	}
	background(rotation,cityData,"rgba(232,166,11,0.5)");
	canvas.addEventListener("mousemove",function(e){
		const canvasInfo = canvas.getBoundingClientRect();
		const isFlat = ctx.isPointInPath(e.clientX - canvasInfo.left,e.clientY - canvasInfo.top);
		if(isFlat){
			isMove = true
			ctx1.clearRect(0,0,canvas.width,canvas.height);
			background(rotation,cityData,"rgba(14,184,212,0.5)");
		}else{
			text.style.cssText = "display:none;"
		}
	})
	window.addEventListener("mousemove",function(e){
		if(isMove){
		// 鼠标移入事件,根据鼠标移入的地点判断这个角度属于哪条数据
			const canvasInfo = canvas.getBoundingClientRect();
			let text = document.getElementById("text")
			let x = e.clientX - canvasInfo.left;
			let y = e.clientY - canvasInfo.top;
			let left = x - (canvasInfo.width/2);
			let top = y - (canvasInfo.height/2);
			let rotate = top / left;
			let result = getTanDeg(rotate);
			let reg;
		//  返回元素的绝对值
			result = Math.abs(result)
			if(left >= 0 && top >= 0){
				reg = result;
			}else if(left < 0 && top > 0){
				reg = 90 + (90 - result);
			}else if(left < 0 && top < 0){
				reg = 180 + result;
			}else{
				reg = 180 + 90 + (90 - result);
			}
			let ind = parseInt(reg / Math.ceil(rotation * 180 / Math.PI));
			text.style.cssText = "left:"+x+"px;top:"+y+"px;display:block;"
			if(cityData[ind] != undefined){
				text.innerHTML = `<span>${cityData[ind].name}</span><span>${cityData[ind].number}</span>`
			}
		}
	})
	canvas.addEventListener("mouseout",function(e){
		const canvasInfo = canvas.getBoundingClientRect();
	//  isPointInPath是canvas提供的方法,通过屏幕坐标返回当前坐标的图形
	// isPointInPath:更多了解请百度
		const isFlat = ctx.isPointInPath(e.clientX - canvasInfo.left,e.clientY - canvasInfo.top);
		if(!isFlat){
			isMove = false
			ctx1.clearRect(0,0,canvas.width,canvas.height);
			background(rotation,cityData,"rgba(232,166,11,0.5)");
			text.style.cssText = "display:none;"
		}
	})
//  返回反正切值
	function getTanDeg(tan){
		var result = Math.atan(tan) / (Math.PI / 180);
		result = Math.round(result);
		return result;
	}
//  绘制线条
	function drawLine(data,ctx,rotation,bgColor){
		ctx.save();
		ctx.translate(center,center)
		ctx.fillStyle = "#ffffff";
		for(let i=0,len=data.length;i<len;i++){
			let x = parseInt(Math.cos(rotation * i) * data[i].number);
			let y = parseInt(Math.sin(rotation * i) * data[i].number);
			let measWidth = ctx.measureText(data[i].name).width;
			ctx.fillText(data[i].number,x-measWidth,y);
		}
		ctx.lineWidth = "3"
		ctx.strokeStyle = "#e8a60b"
		ctx.fillStyle = bgColor;
		ctx.beginPath();
		for(let i=0,len=data.length;i<len;i++){
			let x = parseInt(Math.cos(rotation * i) * data[i].number);
			let y = parseInt(Math.sin(rotation * i) * data[i].number);
			let measWidth = ctx.measureText(data[i].name).width;
			ctx.lineTo(x,y);
			ctx.fillText(data[i].number,x-measWidth,y)
		}
		ctx.closePath();
		ctx.stroke();
		ctx.fill();
		ctx.restore();
	}
//  添加字体
	function drawcity(rotation,rad,total,width){
		ctx.save();
		ctx.translate(center,center)
		ctx.fillStyle = "#0602F8";
		ctx.font = "12px 微软雅黑";
		let rads = (rad + 10);
		for(let i=0;i<total;i++){
		// 此处使用三角函数来计算位置,因为多边形不是平面,有些角度使用三角函数计算是最好的选择
			let x = parseInt(Math.cos(rotation * i) * (width / 2 - rads));
			let y = parseInt(Math.sin(rotation * i) * (width / 2 - rads));
			ctx.beginPath();
			let measText = ctx.measureText(cityData[i].name).width;
			ctx.fillText(cityData[i].name,(x - measText/2),y);
			ctx.closePath();
			ctx.fill();
		}
		ctx.restore();
	}
//  绘制图形
	function arcDraw(rotation,rad,total,width,bgcolor,lineColor){
		ctx.save();
		ctx.translate(center,center);
		for(let i=0;i<total;i++){
			ctx.fillStyle = bgcolor;
			ctx.strokeStyle = lineColor;
			let startRotation = rotation*i;
			let endRotation = rotation*(i+1);
			let startX = Math.cos(startRotation)*(width - rad);
			let startY = Math.sin(startRotation)*(width - rad);
			let endX = Math.cos(endRotation)*(width - rad);
			let endY = Math.sin(endRotation)*(width - rad);
			ctx.beginPath();
			ctx.moveTo(0,0);
			ctx.lineTo(startX,startY);
			ctx.lineTo(endX,endY);
			ctx.lineTo(0,0);
			ctx.closePath();
			ctx.stroke();
			ctx.fill();
		}
		ctx.restore()
	}
}
效果图如下:
