刚学习了计算机图形学这门课程,为奠定根基的算法所倾倒,特此记录一二。
Cohen-Sutherland 算法
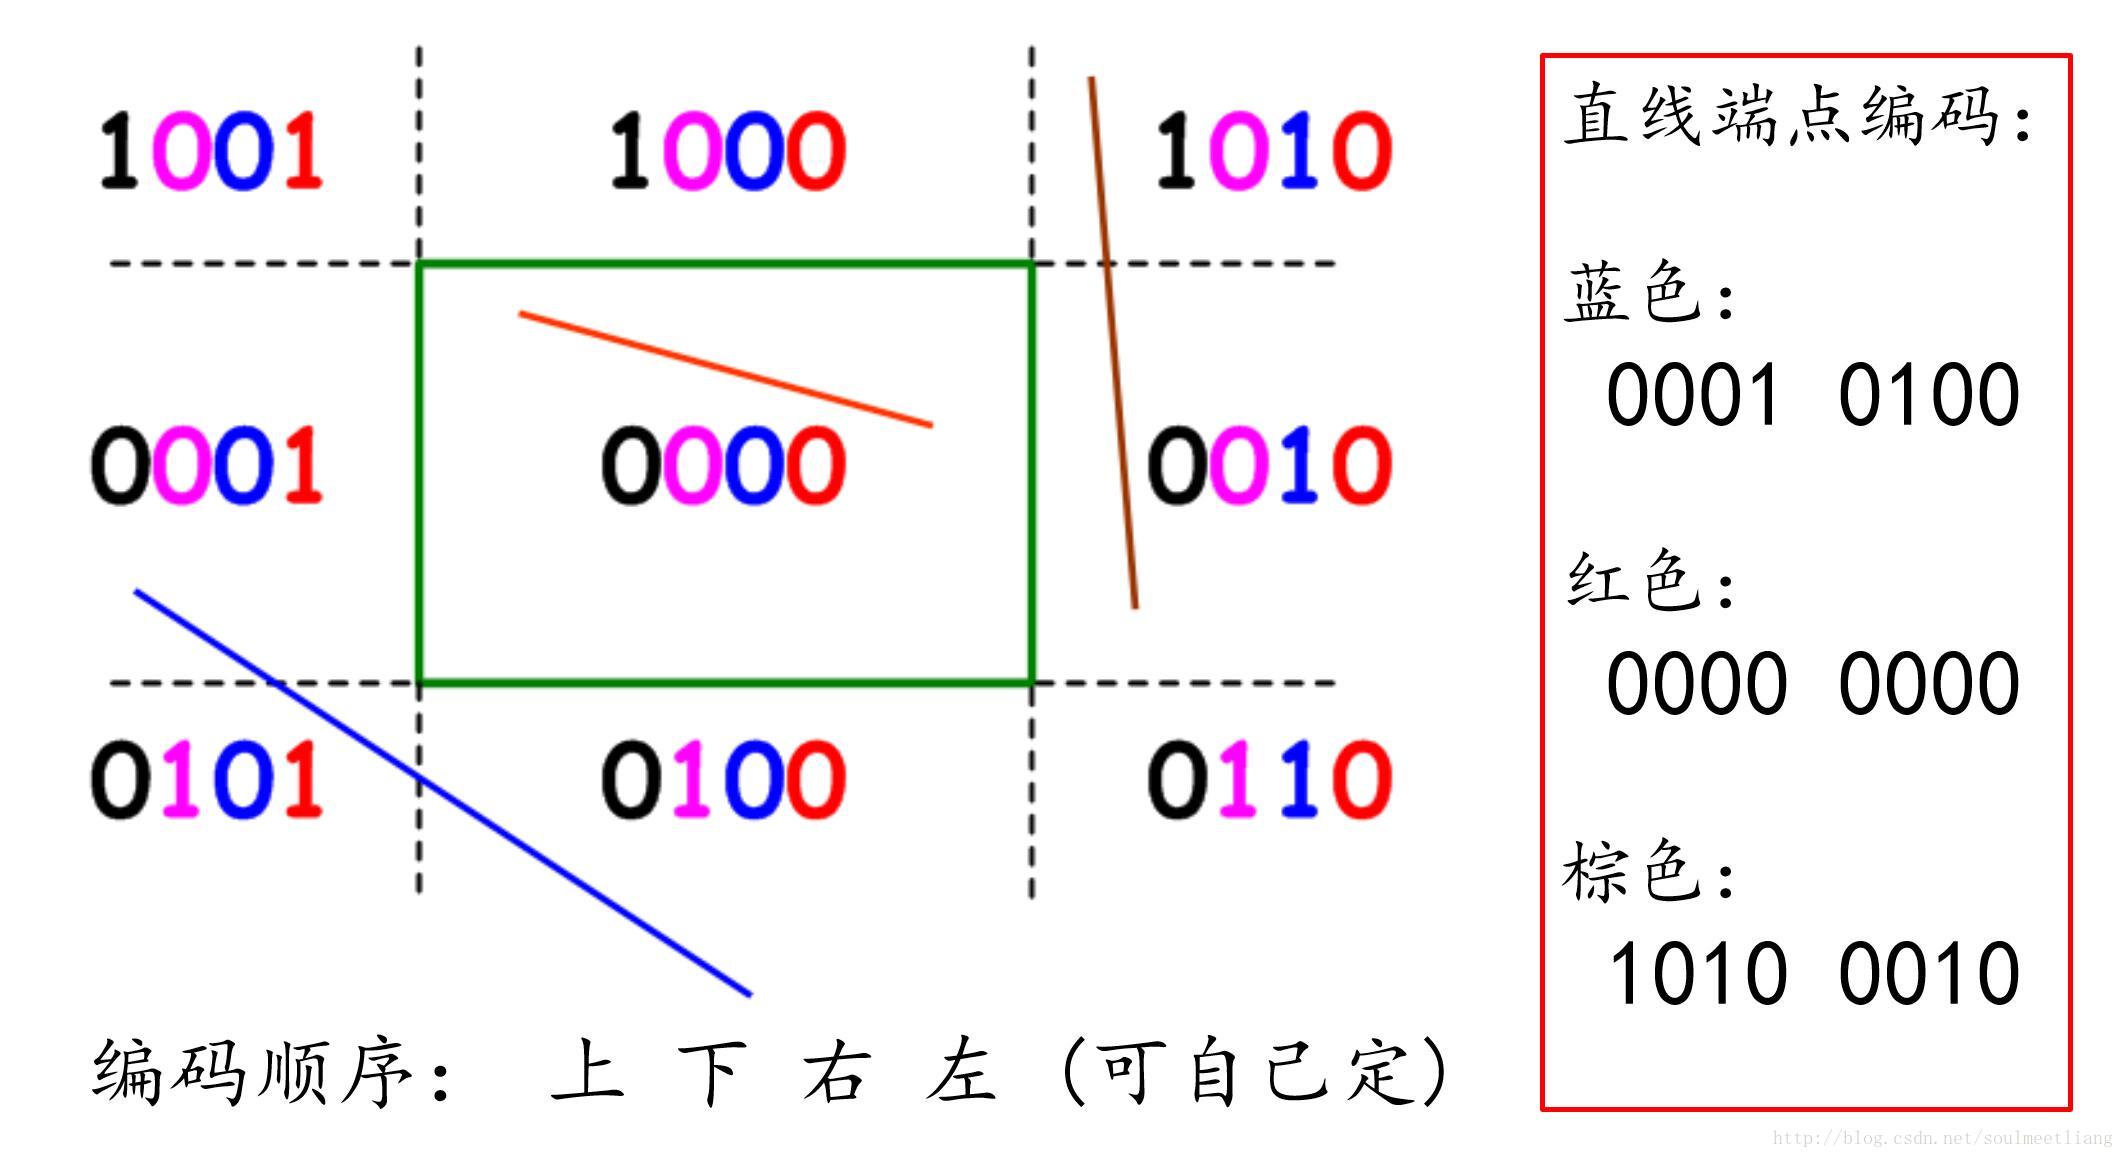
编码
- Cohen-Sutherland 算法是早期图形学算法中的一颗明珠,这种算法使用了一种较少使用的编码方法,较好地解决了直线段的剪裁问题,在效率和简便性上均表现良好。
- 为介绍 Cohen-Sutherland 算法,我们先描述对窗体所在平面的编码。
与或
- Cohen-Sutherland 算法的优点在于,可根据简单的直线端点间的“与”、“或”操作,排除大量无需剪裁的直线段。对这些直线段,因无需进行与边界间的交点计算以及相应的实、虚交点判别,所以大大提高了检测与计算效率。
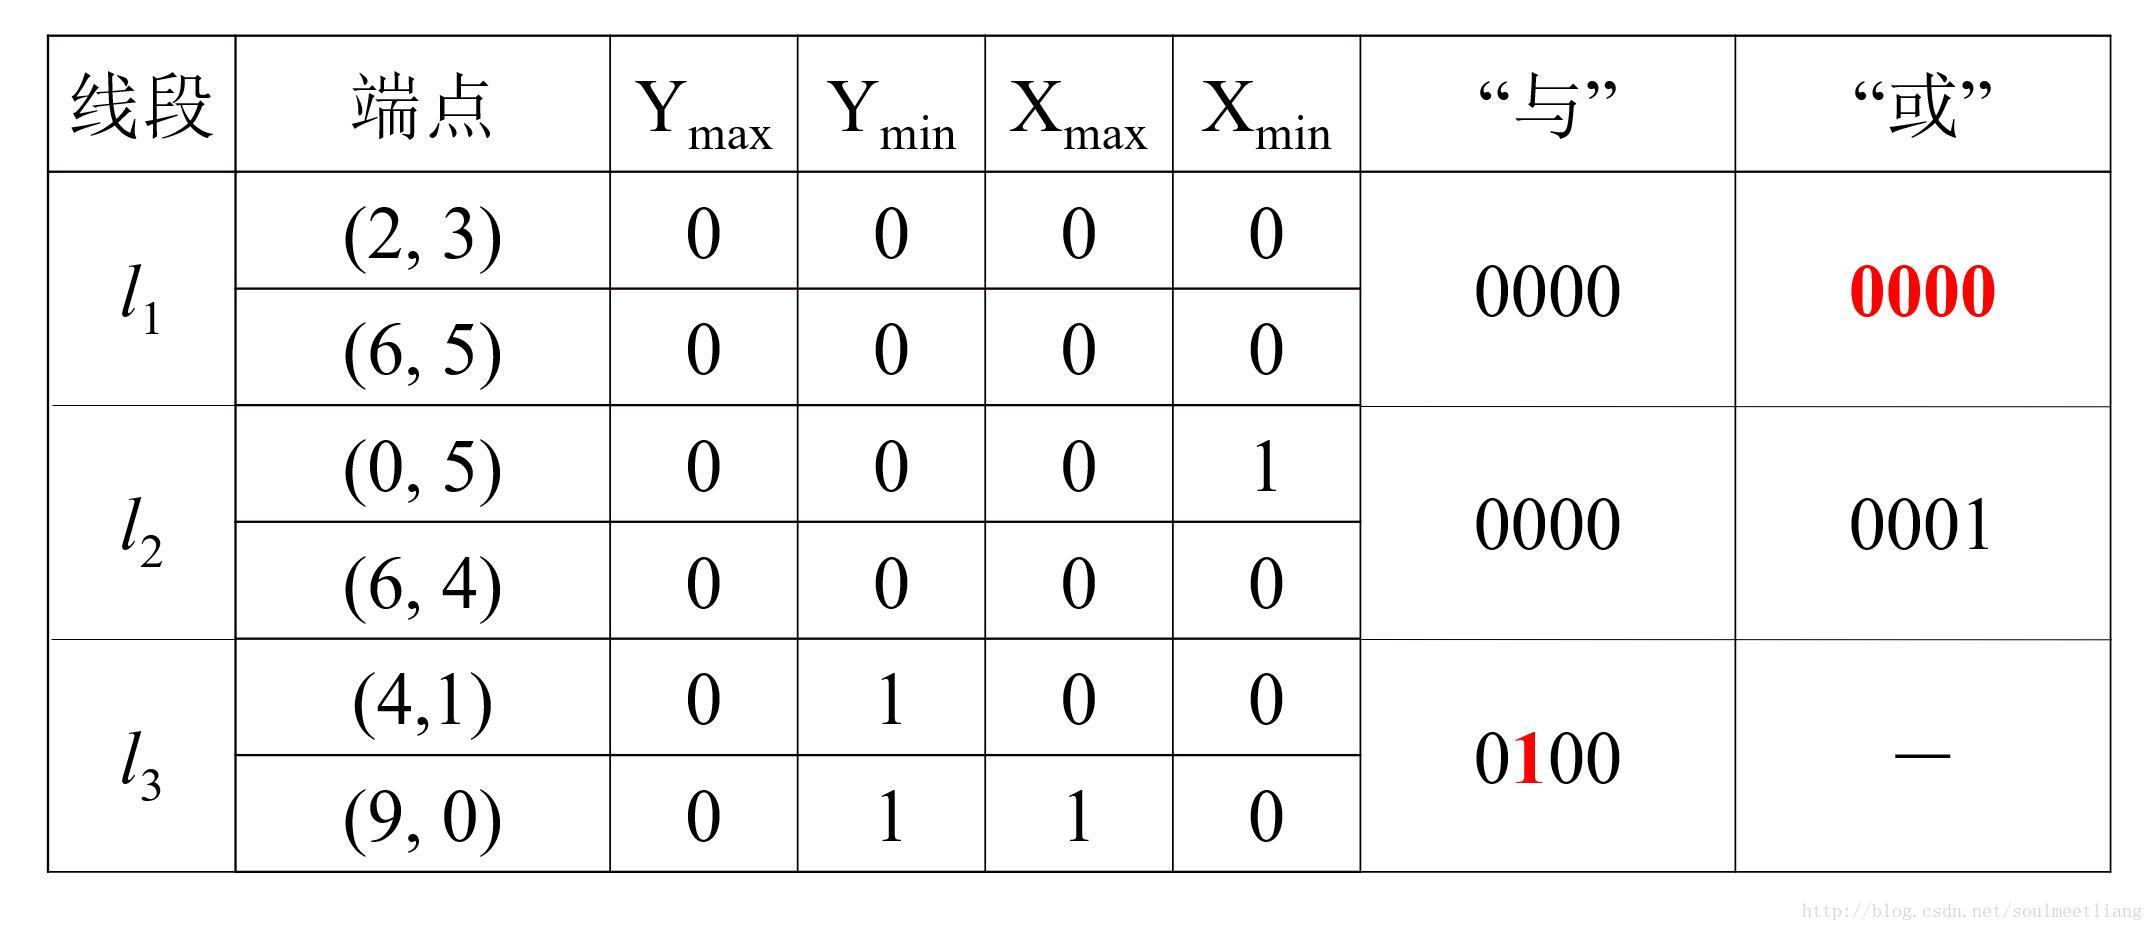
- 窗口内部的点根据两端点编码的“或”运算直接判定:
- 0000 0000 -> 0000 逻辑或
- 大部分窗口外侧的直线段可以根据两端点编码的“与”运算直接判定:
- 1010 0010 -> 0010 逻辑与
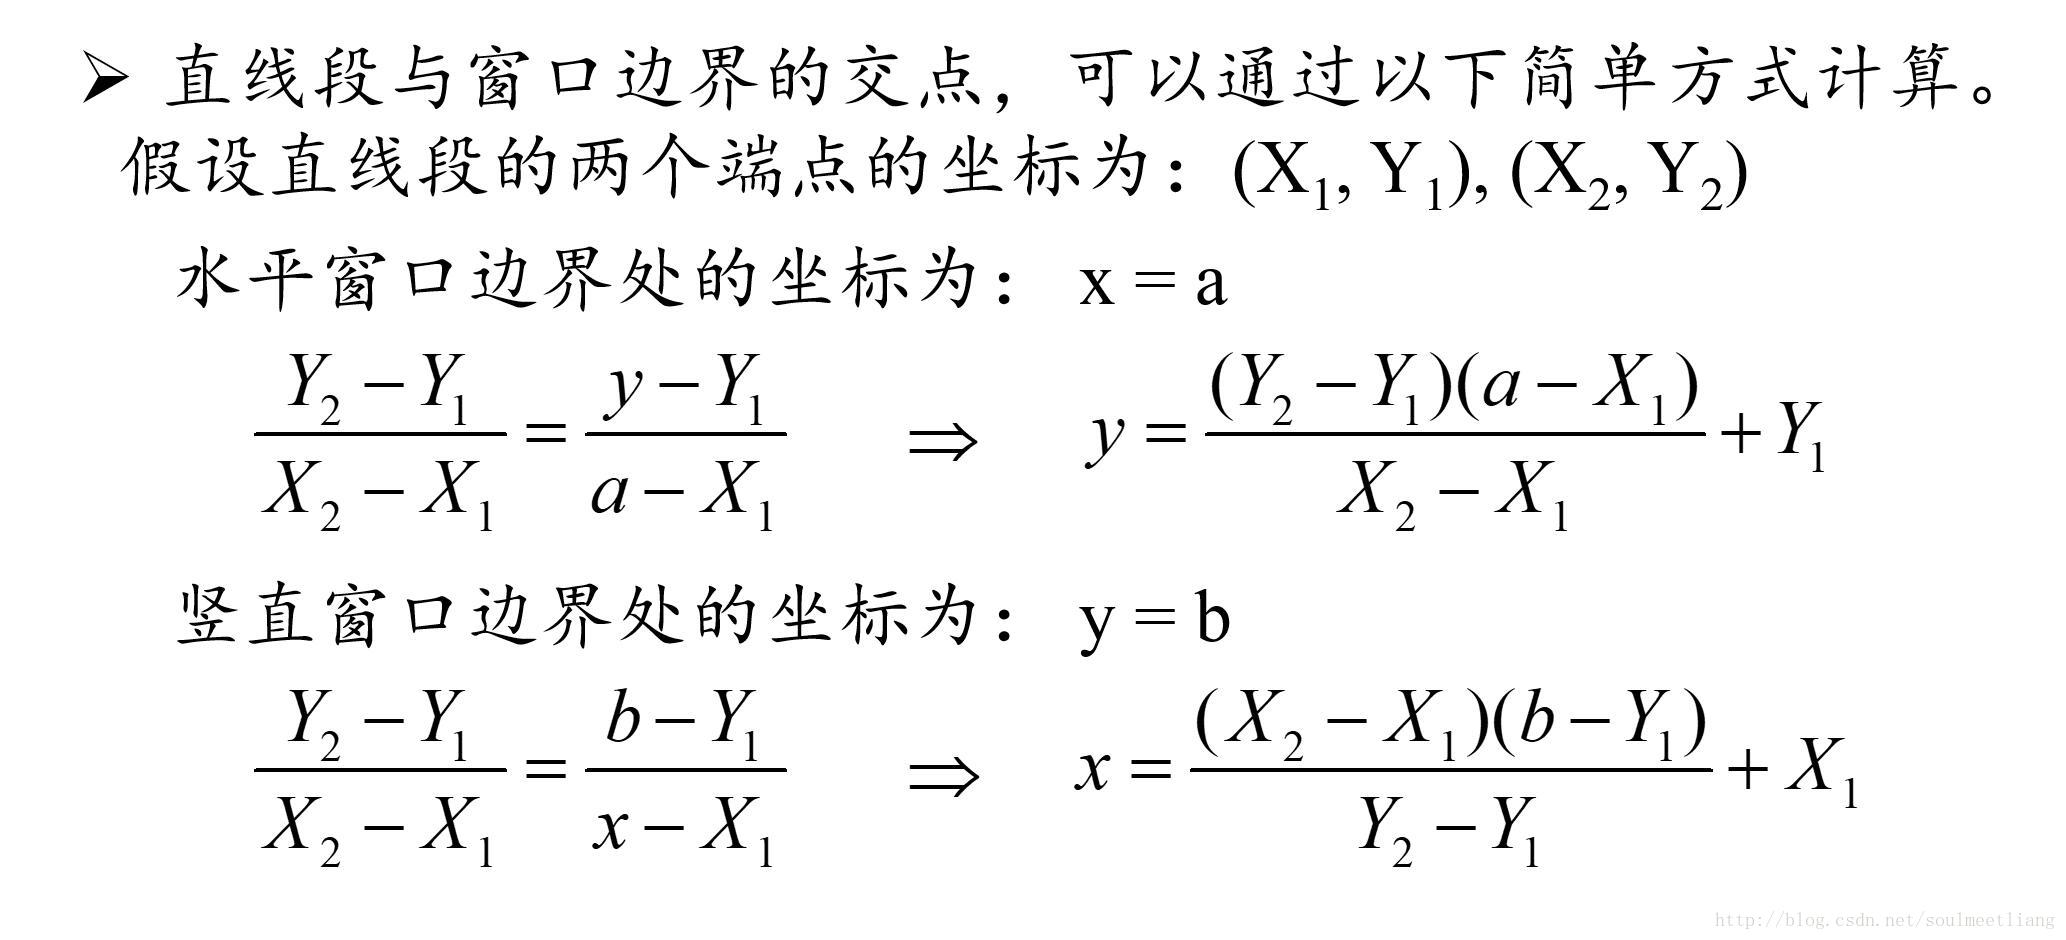
求交
- 对于不能直接排除的直线段,我们需要计算交点。
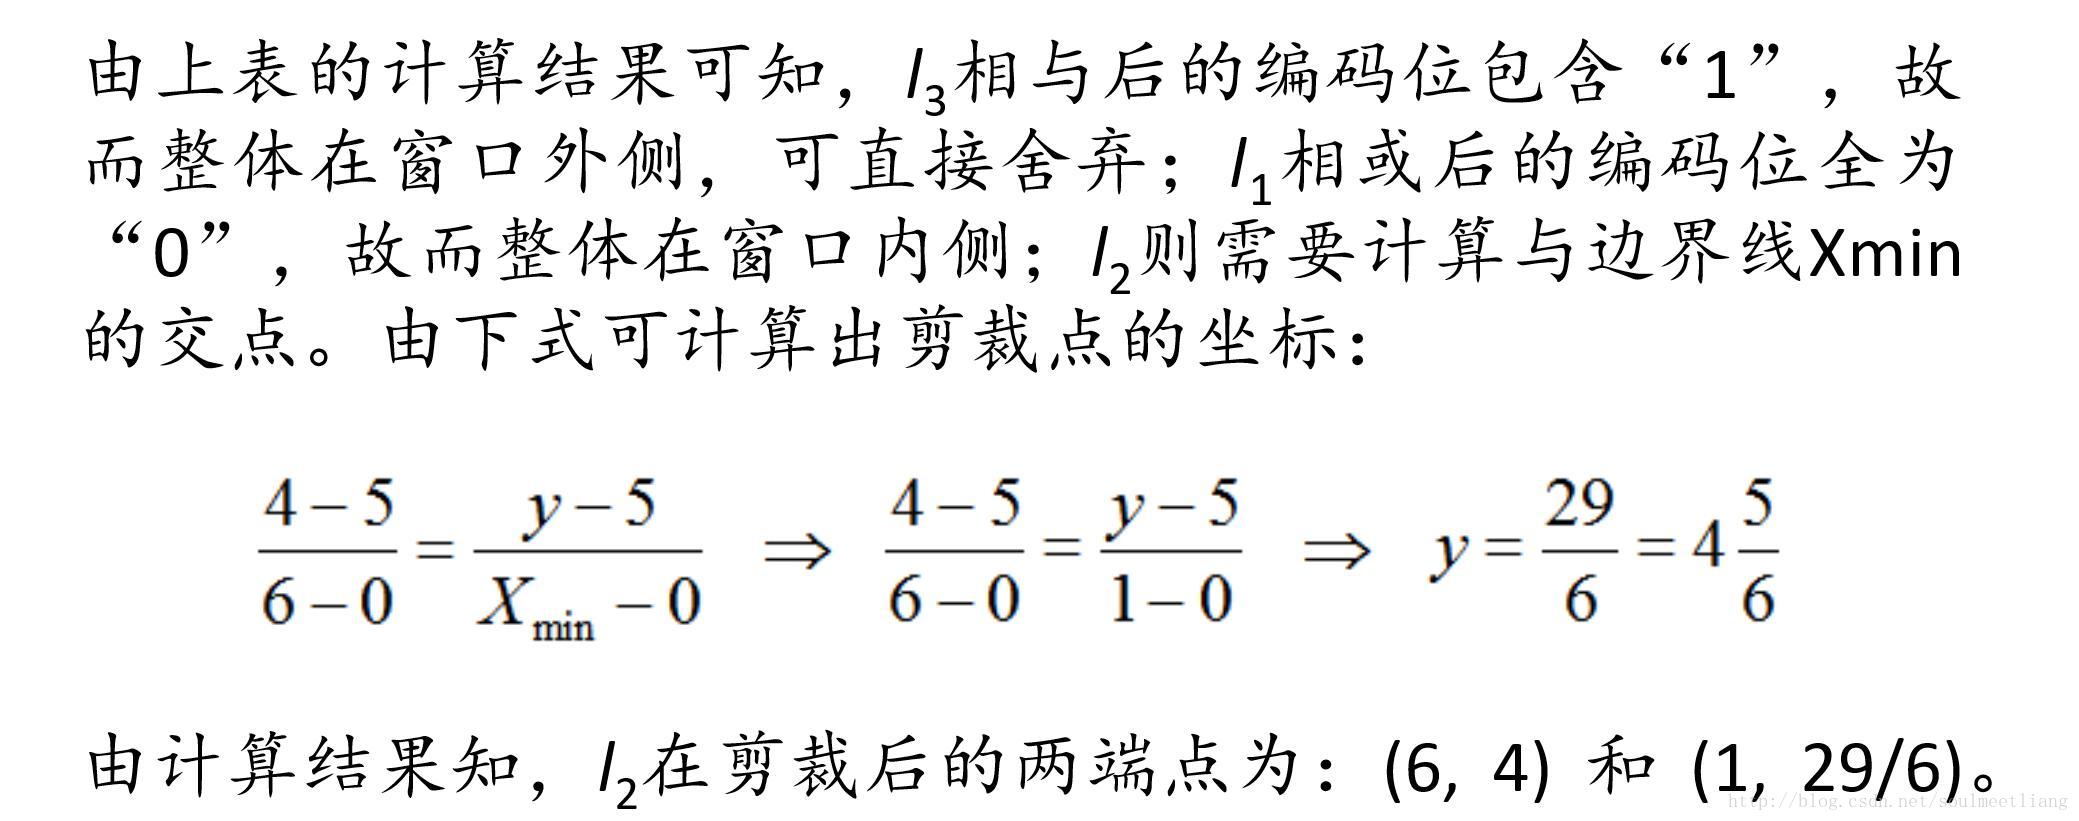
- 在 Cohen-Sutherland 算法中,计算交点是根据编码信息确定的,只有当“或”运算结果为 1 的编码位对应的窗口边界才需要计算交点。
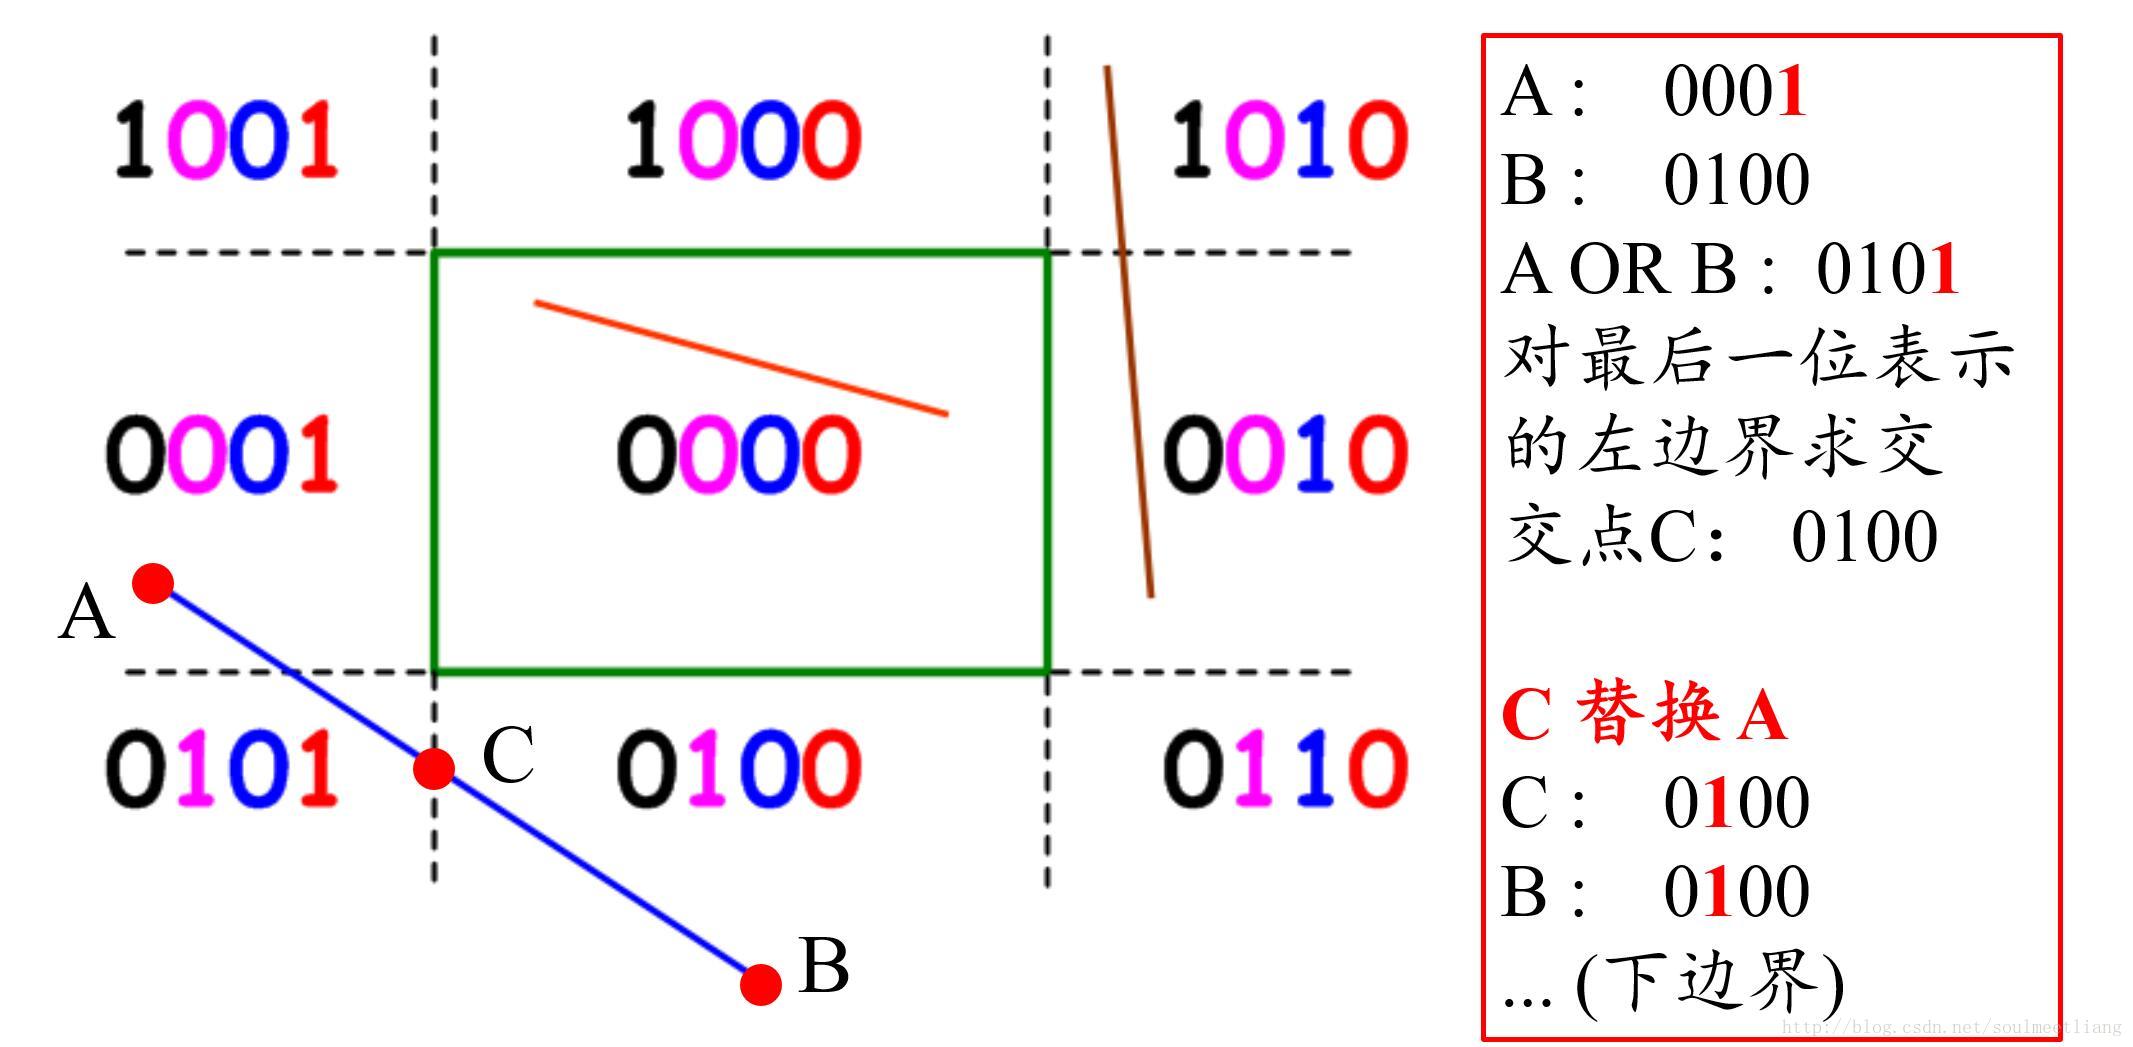
- 如前面的例子中,蓝色直线段不能直接排除,需要计算交点。此时观察其两个端点的编码:
计算
虚实
- 当计算出一个直线段与窗口边界的交点后,我们需要将新计算出的交点替换掉原来此编码位出现 1 的端点。然后与另一端点继续进行“或”运算来判定是否需要计算交点。
- 需要进行上述替换并继续计算交点的原因,是计算出的交点可能是虚交点。
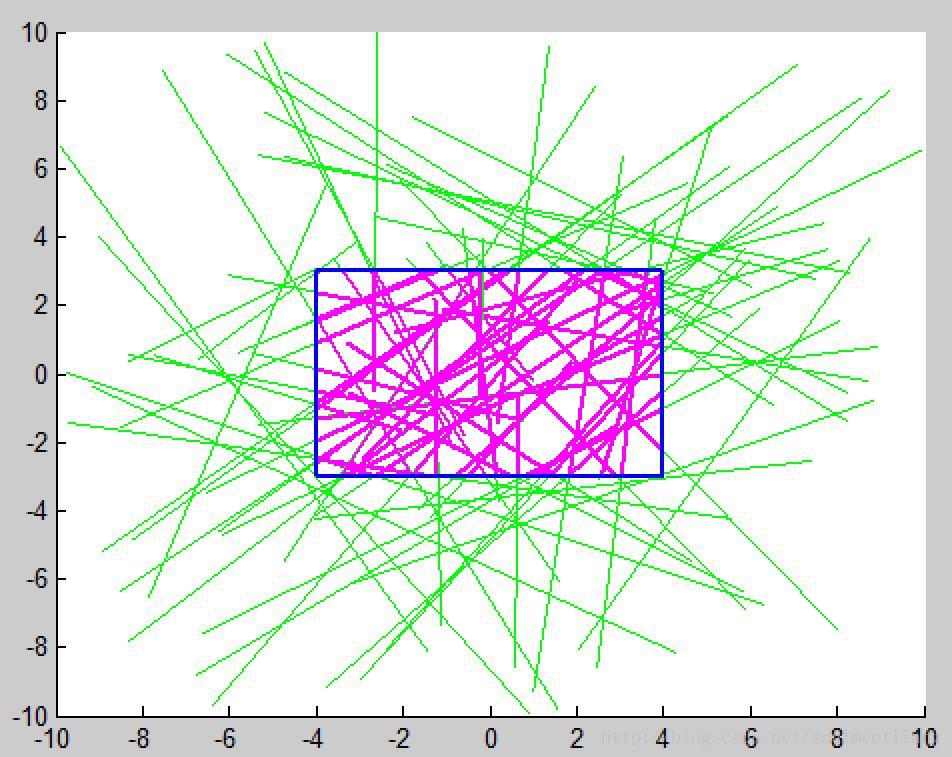
- 只有当最后进行逻辑或判定的两个交点(或端点)最后的或运算结果为 0000 时,整个过程结束。
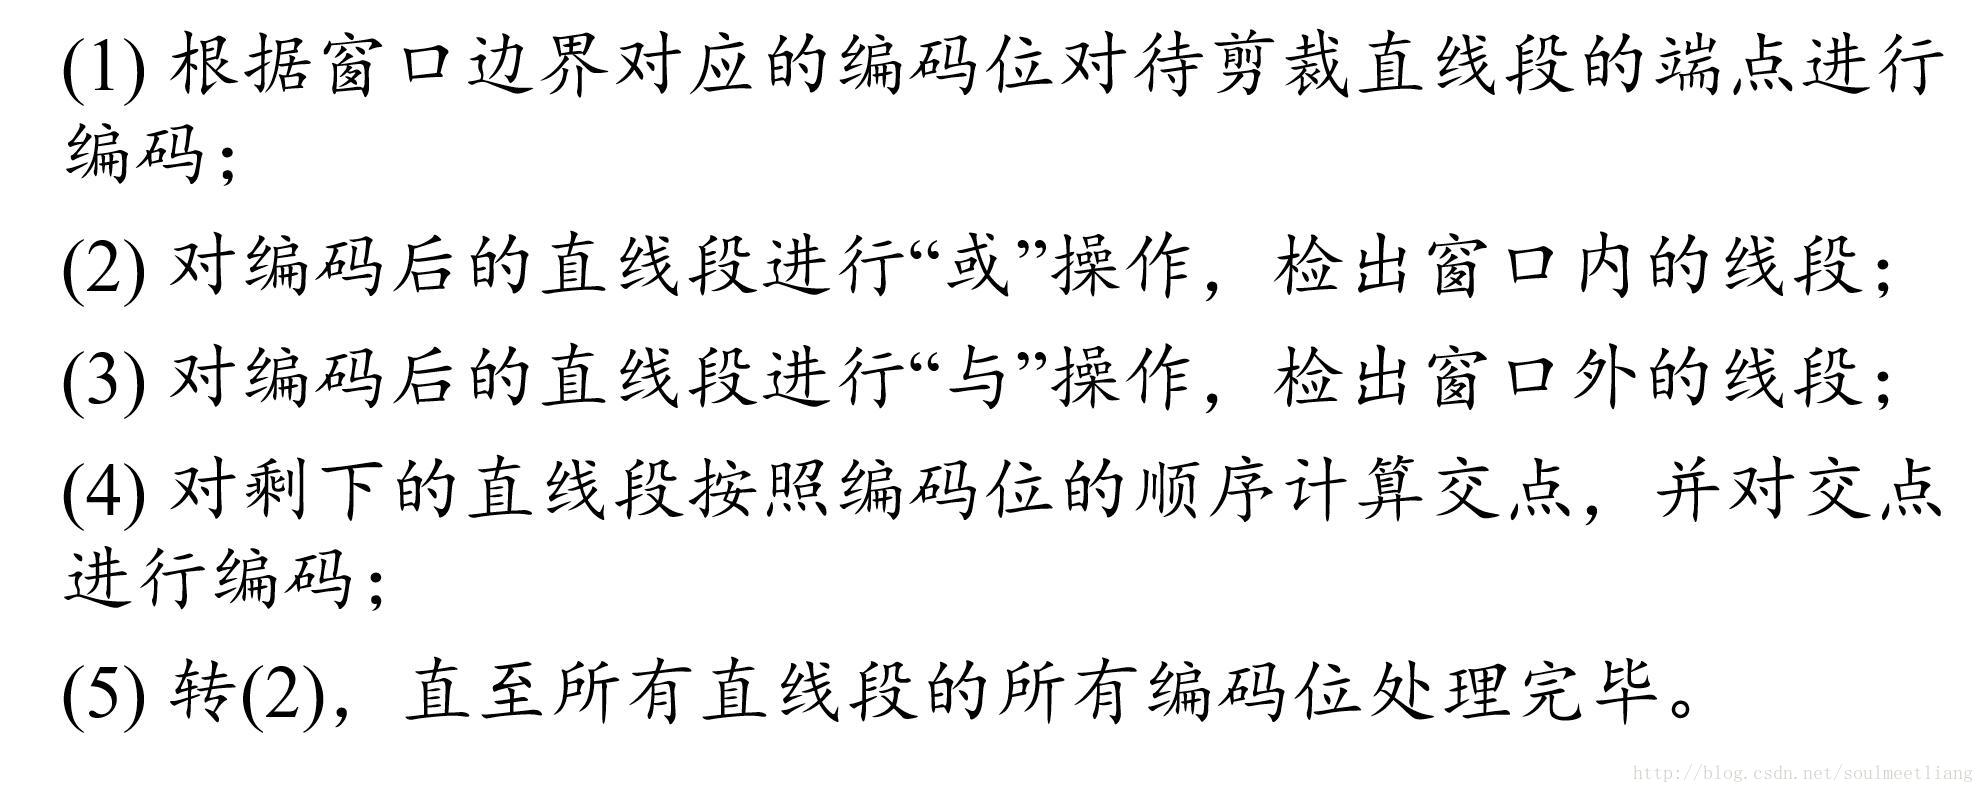
算法
示例
Matlab代码
clear all;

n = 100;
Xmin = -4; Xmax = 4;
Ymin = -3; Ymax = 3;

figure; hold on;

P1x = rand(1,n)*20 - 10;
P2x = rand(1,n)*20 - 10;
P1y = rand(1,n)*20 - 10;
P2y = rand(1,n)*20 - 10;
P1code = zeros(n,4);
P2code = zeros(n,4);

for i = 1:n

    if P1x(i) < Xmin
        P1code(i,1) = 1;
    end
    if P1x(i) > Xmax
        P1code(i,2) = 1;
    end
    if P1y(i) < Ymin
        P1code(i,3) = 1;
    end
    if P1y(i) > Ymax
        P1code(i,4) = 1;
    end

    if P2x(i) < Xmin
        P2code(i,1) = 1;
    end
    if P2x(i) > Xmax
        P2code(i,2) = 1;
    end
    if P2y(i) < Ymin
        P2code(i,3) = 1;
    end
    if P2y(i) > Ymax
        P2code(i,4) = 1;
    end

    plot([P1x(i),P2x(i)],[P1y(i),P2y(i)],'b-');
end
hold off;

P_label = zeros(1,n);
figure; hold on;
for i = 1:n
    P_or = P1code(i,1:4) | P2code(i,1:4);
    if sum(P_or) == 0
        P_label(i) = 1;
        plot([P1x(i),P2x(i)],[P1y(i),P2y(i)],'r-');
    end
    P_and = P1code(i,1:4) & P2code(i,1:4);
    if sum(P_and) > 0
        P_label(i) = 2;
        plot([P1x(i),P2x(i)],[P1y(i),P2y(i)],'g-');
    end
end
hold off;

figure; hold on;
for i = 1:n
    if P_label(i) == 0

        P_or = P1code(i,1:4) | P2code(i,1:4);
        plot([P1x(i),P2x(i)],[P1y(i),P2y(i)],'g-');

        if P_or(1) == 1
            Py = P1y(i) + (Xmin-P1x(i))*(P2y(i)-P1y(i))/(P2x(i)-P1x(i));
            if P1x(i) < Xmin
                P1x(i) = Xmin; P1y(i) = Py;
            elseif P2x(i) < Xmin
                P2x(i) = Xmin; P2y(i) = Py;
            end
        end

        if P_or(2) == 1
            Py = P1y(i) + (Xmax-P1x(i))*(P2y(i)-P1y(i))/(P2x(i)-P1x(i));
            if P1x(i) > Xmax
                P1x(i) = Xmax; P1y(i) = Py;
            elseif P2x(i) > Xmax
                P2x(i) = Xmax; P2y(i) = Py;
            end
        end

        if P_or(3) == 1
            Px = P1x(i) + (Ymin-P1y(i))/(P2y(i)-P1y(i))*(P2x(i)-P1x(i));
            if P1y(i) < Ymin
                P1x(i) = Px; P1y(i) = Ymin;
            elseif P2y(i) < Ymin
                P2x(i) = Px; P2y(i) = Ymin;
            end
        end

        if P_or(4) == 1
            Px = P1x(i) + (Ymax-P1y(i))/(P2y(i)-P1y(i))*(P2x(i)-P1x(i));
            if P1y(i) > Ymax
                P1x(i) = Px; P1y(i) = Ymax;
            elseif P2y(i) > Ymax
                P2x(i) = Px; P2y(i) = Ymax;
            end
        end
        if P1x(i) >= Xmin & P1x(i) <= Xmax & ...
                P2x(i) >= Xmin & P2x(i) <= Xmax & ...
                P1y(i) >= Ymin & P1y(i) <= Ymax & ...
                P2y(i) >= Ymin & P2y(i) <= Ymax
            plot([P1x(i),P2x(i)],[P1y(i),P2y(i)],'m-','LineWidth',2);
        end
        plot([-4 4 4 -4 -4],[-3 -3 3 3 -3],'b-','LineWidth',2);
    end
end
hold off;
