Bootstrap

让3D Plot类型的图片旋转起来...(Mathematica)

比葫芦画瓢一个大笑


http://mathematica.stackexchange.com/questions/3759/autorotating-3d-plots

These days, I have to produce quite a few 3D surface plots (mostly functions of the type  ρ(θ,ϕ)  plotted with SphericalPlot3D). To exchange these results colleagues who don’t use Mathematica, or to include them in presentations, I need to export these plots as movies showing the surface rotating. What I’d love to do is to be able to choose one graph, and just export it as autorotating around the current vertical axis (i.e. the axis contain in the plane of the screen, and directed upwards).

This not being possible, I'm trying to do the next best thing: a procedure that takes as an argument the produced 3D graphics (say, the output of SphericalPlot3D) and makes it automatically rotate. Here’s what I’ve been able to do with Animate, but I could follow the same logic and export it directly instead.

rotateMeHarder[g_] := Module[{range},
   range = Max /@ (Abs@PlotRange /. AbsoluteOptions[g, PlotRange]);
   Animate[
    Show[
     Graphics3D[{Red, Thick, Line[{{-1.2*range[[1]], 0, 0}, {1.2*range[[1]], 0, 0}}]}],
     Graphics3D[{Green, Thick, Line[{{0, -1.2*range[[2]], 0}, {0, 1.2*range[[2]], 0}}]}],
     Graphics3D[{Blue, Thick, Line[{{0, 0, -1.2*range[[3]]}, {0, 0, 1.2*range[[3]]}}]}],
     g,
     ViewPoint -> RotationTransform[\[Theta], {0, 0, 1}][{0, 2*Max@range, 0.2*Max@range}],
     SphericalRegion -> True, Boxed -> False],
    {\[Theta], \[Pi]/20, 2 \[Pi] + \[Pi]/20, \[Pi]/20}]
   ];

p = SphericalPlot3D[
  10 + 5*Re@SphericalHarmonicY[3, -3, \[Theta], \[Phi]], \[Theta], \[Phi],
  Boxed -> False, Axes -> None, PlotStyle -> Opacity[0.7]];
rotateMeHarder[p]

What I like about this:

  • It does generate a nicely rotating object in simple cases.
  • It draws axis lines on top of my graph, but that's just because it looks great on my pictures, it's not a requirement for the question…

What I don’t like, or am unsure about:

  • It doesn’t start with the current orientation of the graph, but works with a fixed rotation vector (along the 3D  z  axis) and a fixed starting position (slightly above the  xy  plane). If I understood this answercorrectly, they is not way of retrieving the current viewpoint for a given interactive 3D graph. So bad!.
  • It doesn’t seem very robust. In particular, it only works for 3D plots centered around the origin, which extend about the same length in each axis direction (i.e. does not deal with very anisotropic surfaces).
  • It leaves a lot of white padding around the graphics.

So, the question is: what do you think of this code? How could I make it more general, more robust, or in any way closer to my initial goal of a one-size-fits-all exporting procedure for 3D graphics?

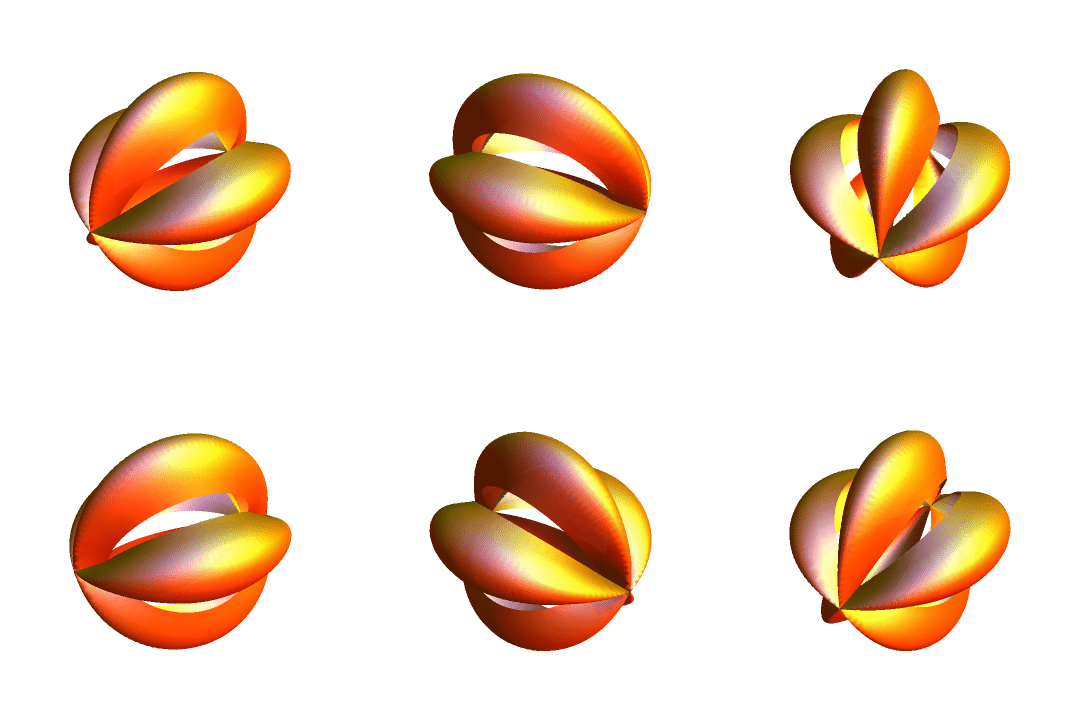
share edit flag
 
 
Adding RotationAction -> "Fit" will keep objects inside your frame during Animation. –   R Hall  Mar 31 '12 at 13:37
 
 
The old Graphics`Animation`  package had the SpinShow[] function... –   J. M.  Sep 28 '12 at 11:57
 
add comment
 

1 Answer

up vote 25 down vote accepted

Note that ViewPoint is given in specially scaled coordinates which depend on amongst things the size of the bounding box. To get better control over the positioning of the camera you could use ViewVectorinstead, which is given in terms of the coordinates of the plot. You could for example do something like this:

rotateMeHarder1[g_, vertical_, viewpoint0_, center_List: {0, 0, 0}, 
  nframes_Integer: 15, opts : OptionsPattern[]] := Module[{grlist},
  grlist = 
   Table[Show[g, ViewVertical -> vertical, 
     ViewVector -> {RotationMatrix[2 Pi/nframes i, 
          vertical].(viewpoint0 - center) + center, center},
     SphericalRegion -> True, opts], {i, 0, nframes - 1}]]

where g is the Graphics3D object, vertical is the vertical axis, viewpoint0 is the starting position of the camera, center is the center of the graph, nframes is the number of frames, and opts are additional options of the graph.

Usage

To create an animation of the plot p in the original question rotating around the axis anchored at {10, 0, 0} and direction {0, 1, 0}, and initial camera position {30, 30, 30} you could do something like

p = SphericalPlot3D[10 + 5*Re@ SphericalHarmonicY[3, -3, \[Theta], \[Phi]], 
  \[Theta], \[Phi], Boxed -> False, Axes -> True, 
  AxesOrigin -> {0, 0, 0}, AxesStyle -> {{Thick, Red}, {Thick, Green}, {Thick, Blue}}, 
  Ticks -> None, PlotStyle -> Opacity[0.7]];

grlist = rotateMeHarder1[p, {0, 1, 0}, {30, 30, 30}, {10, 0, 0}, 20, 
  ViewAngle -> 50 Degree]

ListAnimate[grlist]

Note that I'm using ViewAngle to adjust the size of the graphics relative to the viewing area. By increasing the ViewAngle you effectively zoom out and vice versa. Another option to change the relative size of the graphics would be to change the distance of the initial camera position to the axes of rotation.

You can use Export to create an animated .gif or other type of movie, e.g.

Export["movie.gif", grlist];

enter image description here

This solution requires some manual tuning especially in choosing the initial view vector and the view angle. You could for example use Manipulate to experiment with values for these parameters.

share edit flag
 
 
I think most of these I had found myself, except the difference between ViewPoint and ViewVector, which was still unclear to me… thanks! However, this still requires lots of manual intervention, choosing all those values by hand. Any chance of getting closer to a nicer user experience? –   F'x  Mar 31 '12 at 13:43
 
add comment


;