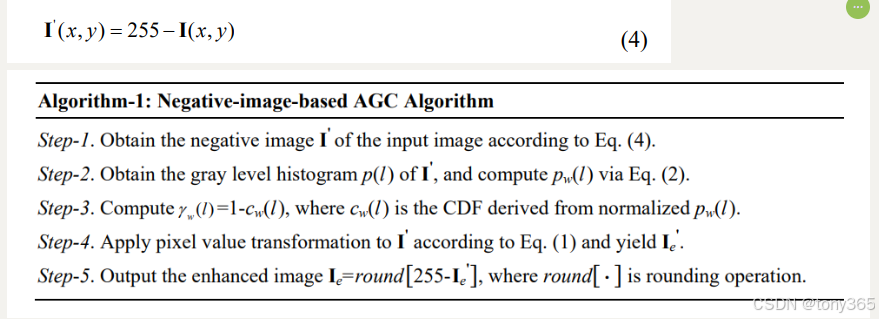
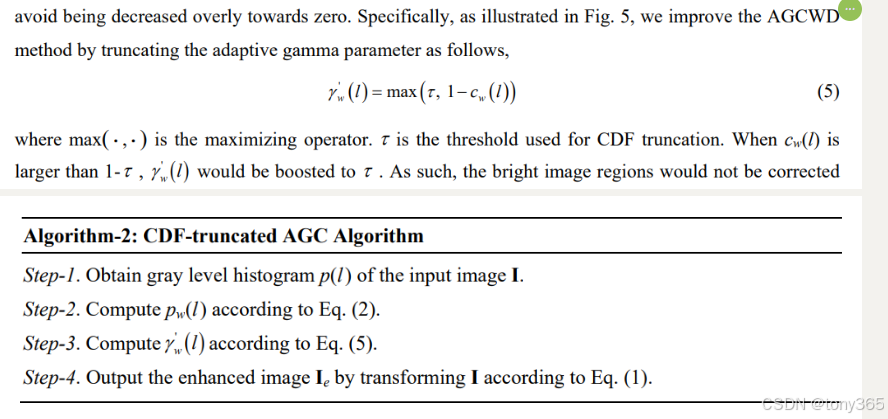
文章目录
Contrast Enhancement of Brightness-Distorted Images by Improved Adaptive Gamma Correction (2017)
Gang Cao1*, Lihui Huang1
, Huawei Tian2
, Xianglin Huang3
, Yongbin Wang1
, Ruicong Zhi4
code:https://github.com/leowang7/iagcwd/tree/master
paper: https://arxiv.org/pdf/1709.04427
1.介绍 Efficient contrast enhancement with adaptive gamma correction
S.-C. Huang, F.-C. Cheng, and Y.-S. Chiu
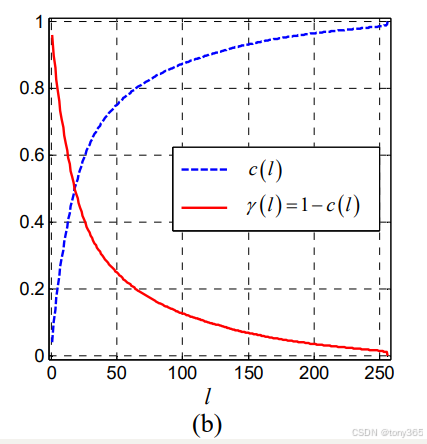
首先计算累积直方图c,gamma = 1-c
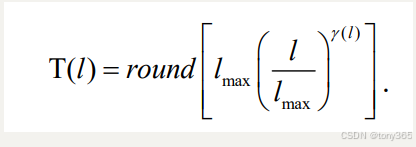
然后 apply gamma:
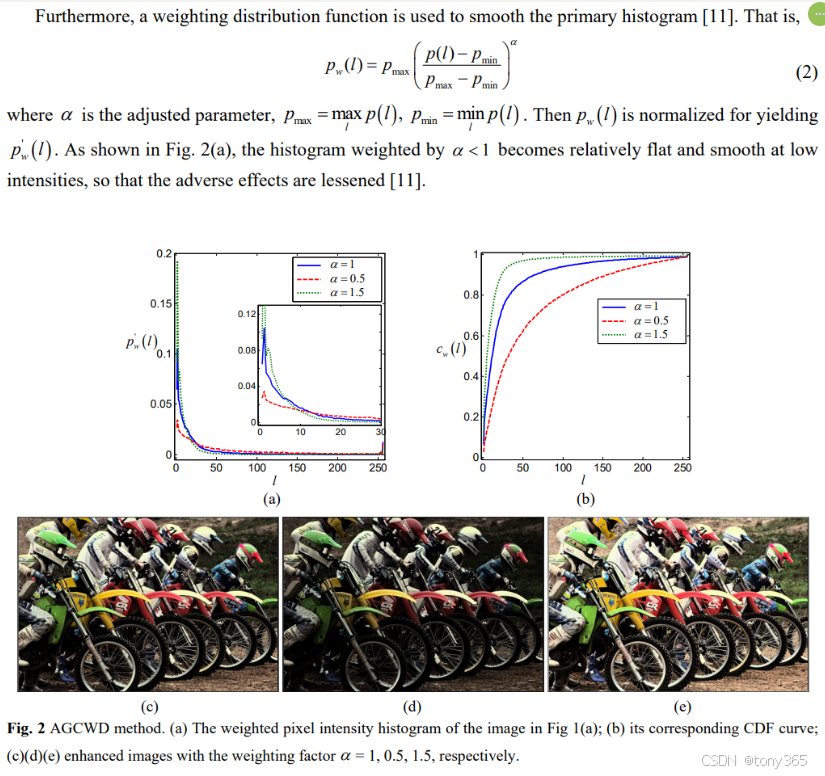
通过以上可知 gamma和累积直方图有关系。因此对直方图进行不同程度的平滑可以得到不同的累积直方图, 如下图b: alpha=0.5,1,1.5时的累积直方图的变化
梳理一下主要步骤:
对YUV的Y 或者 hsv的v 通道处理
1)首先计算直方图p
2) 然后根据公式2计算 pw, normalized后的 pw’=pw/pw.sum(), 这里有参数alpha可调
3) 然后计算累积直方图c, 和 gamma=1-c
4) 最后apply gamma
但是上面的方法有2个缺陷:
1是对于过亮的图像处理不好
2是对于过暗的图像:the image distortion may be incurred in bright regions due to the improper setting of rather low gamma values for large pixel intensities, 也就是在明亮区域,由于在像素值大的pixel会被设置过低的伽马值,可能会导致图像失真
2.作者提出2个方案改进上述方法,主要框架:
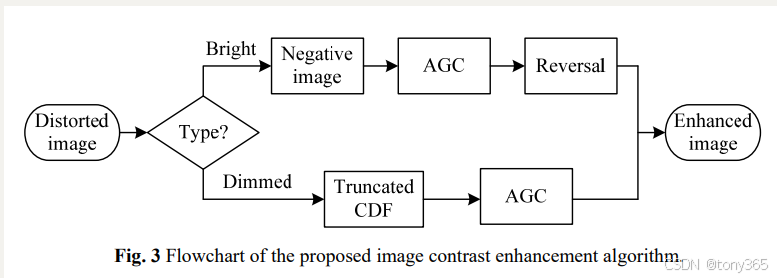
2.1 亮度判断
t = (mean - 0.5) / 0.5
表示图像均值与0.5的差距, 如果差距在 tao范围内则认为图像亮度是恰当的,不做改变。
2.2 对于过亮图像
2.3 对于过暗图像
3.复现结果展示
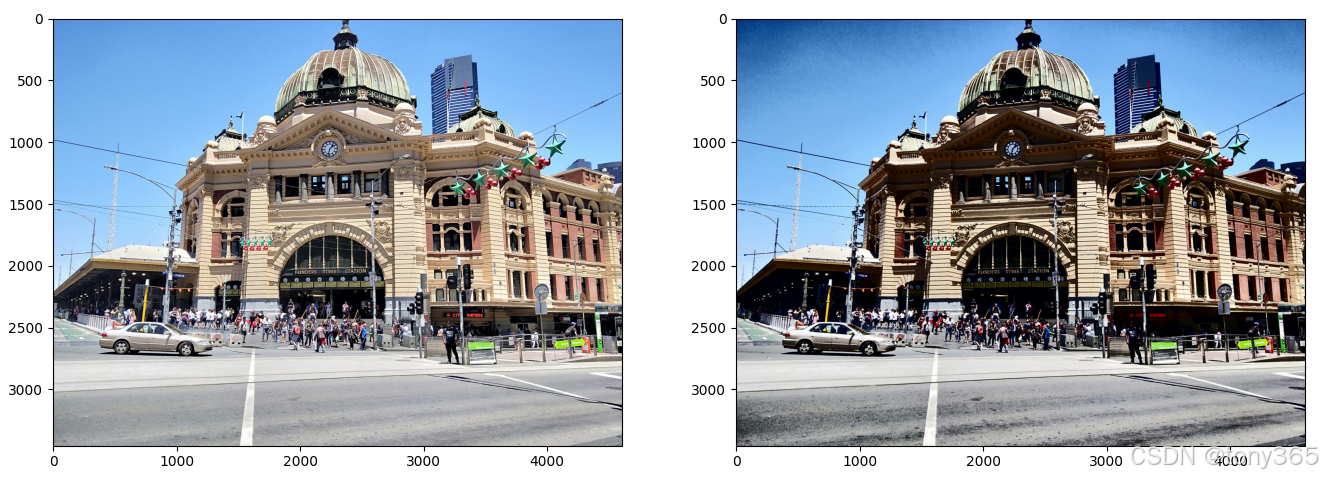
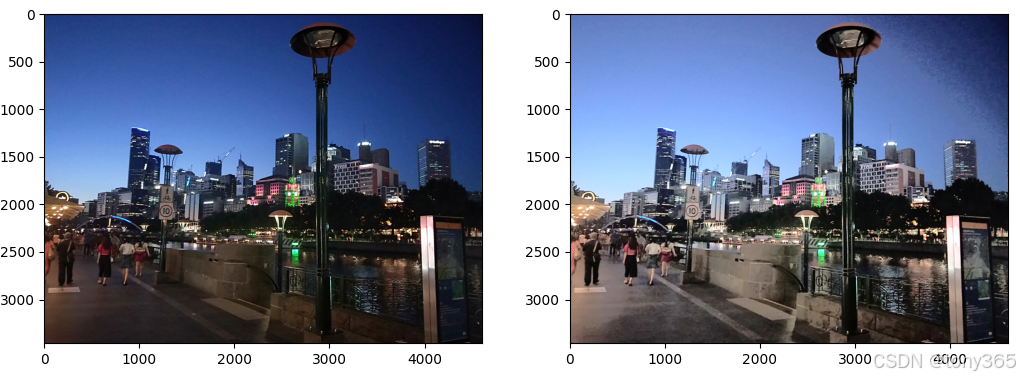
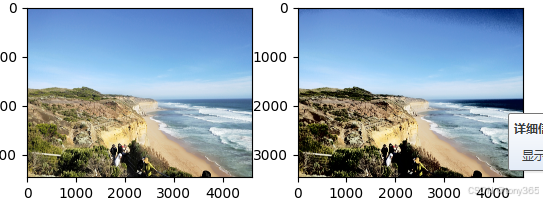
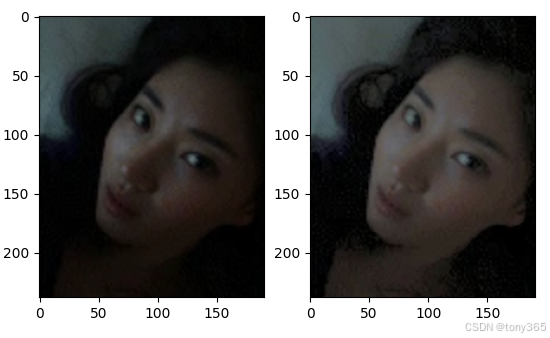
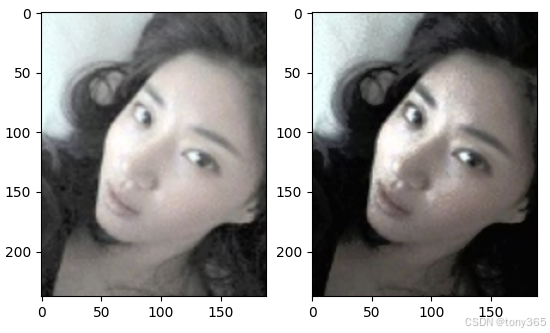
没有达到原文的效果,不知道哪里的错误。
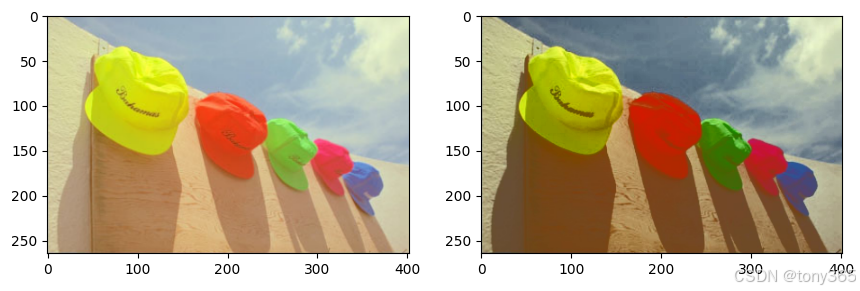
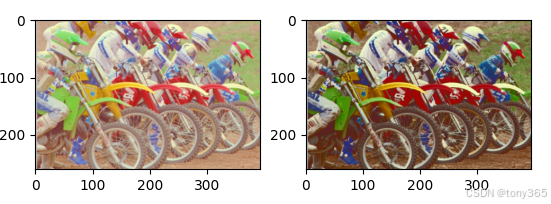

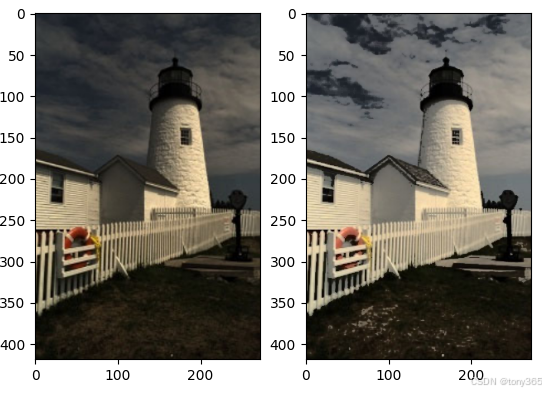
下面附上代码:利用原论文中的图片截屏处理后得不到原文中类似的效果,欢迎大家分析指正
"""
Contrast Enhancement of Brightness-Distorted Images by Improved Adaptive Gamma Correction
Gang Cao1*, Lihui Huang1
, Huawei Tian2
, Xianglin Huang3
, Yongbin Wang1
, Ruicong Zhi4

其他版本code:https://github.com/leowang7/iagcwd
"""
import cv2
import matplotlib.pyplot as plt
import numpy as np


def agc0(Y, alpha, truncated):
    # 直方图
    p = cv2.calcHist(Y, [0], None, [256], [0, 256])
    # 直方图smooth
    #plt.figure()
    #plt.plot(np.arange(len(p)), p, )
    #plt.show()

    pmax = np.max(p)
    pmin = np.min(p)
    pw = ((p - pmin) / (pmax - pmin)) ** alpha
    pw = pw * pmax

    #plt.figure()
    #plt.plot(np.arange(len(p)), pw, )
    #plt.show()

    # 直方图norm
    pw_norm = pw / pw.sum()
    #plt.figure()
    #plt.plot( np.arange(len(pw_norm)), pw_norm,'b-',)
    #plt.show()

    # 累积直方图和gamma
    c = pw_norm.cumsum()
    print(c.max(), c.sum())

    #plt.figure()
    #plt.plot(np.arange(len(c)), c, 'b-', np.arange(len(c)), p.cumsum()/p.sum(), 'r-',)
    #plt.show()

    gamma = 1 - c
    #print('gamma:', gamma)
    #plt.figure()
    #plt.plot(np.arange(len(gamma)), gamma,'+', np.arange(len(gamma)), c,'g-',)
    #plt.show()
    if truncated:
        gamma = np.maximum(0.5, gamma)
    # apply gamma
    ret = np.round(Y.max() * ((Y / Y.max()) ** gamma[Y]))
    ret = ret.clip(0, 255).astype(np.uint8)
    return ret

def improved_agc(img):
    """
    :param img: uint8 bgr
    :param alpha:
    :return:
    """
    # Extract intensity component of the image
    YCrCb = cv2.cvtColor(img, cv2.COLOR_BGR2YCrCb)
    Y = YCrCb[:, :, 0]

    #Y = cv2.blur(Y, (5, 5))
    # Determine whether image is bright or dimmed
    threshold = 0.2
    t = (np.mean(Y) - 112) / 112

    if t < -threshold: # dimmed
        print('dimmed image ', t)
        ret = agc0(Y, 0.75, True)
    elif t > threshold*0.5: # bright
        print('bright image ', t)
        print(Y.dtype)
        Y_neg = 255 - Y
        print(Y_neg.dtype)
        ret = agc0(Y_neg, 0.25, False)
        ret = 255 - ret
    else:
        ret = Y
    YCrCb[:, :, 0] = ret
    img_output = cv2.cvtColor(YCrCb, cv2.COLOR_YCrCb2BGR)
    return img_output

if __name__ == "__main__":


    file = r'D:\dataset\Snipaste_2024-11-22_10-46-42.png'
    # file = r'D:\dataset\Snipaste_2024-11-21_17-13-55.png'
    # file = r'D:\dataset\Snipaste_2024-11-22_09-54-26.png'
    # file = r'D:\dataset\Snipaste_2024-11-22_09-56-01.png'

    file = r'D:\dataset\Snipaste_2024-11-21_17-14-25.png'
    img = cv2.imread(file, 1)

    ret = improved_agc(img)

    plt.figure()
    plt.subplot(121)
    plt.imshow(img[... ,::-1])
    plt.subplot(122)
    plt.imshow(ret[... ,::-1])
    plt.show()