darknet 训练过程中,需要对训练输出结果实时分析,根据日志可视化训练结果。
日志生成&释义
- yoloV3训练,log日志重定向
tiny.log- 训练命令,生成log日志
2>&1:训练时把标准错误输出也重定向到标准输出> tiny.log:输出重定向到tiny.log文件中
./darknet detector train cfg/voc.data cfg/yolov3-tiny.cfg yolov3-tiny.conv.15 -gpus 0,1 2>&1 > tiny.log
- 训练过程实时查看
- 循环读取显示最新的log日志
tail -f tiny.log
- 训练数据释义
Region:只有16和23两个yolo层(16层检测大目标,23层检测小目标)Avg IOU:当前subdivision内图片的平均IOUClass:标注物体分类的准确率Obj:越接近1越好No Obj:期望越小越好,但不为0count:表示当前层与真实label正确配对的box数,其中所有参数都是针对这个值的平均值,除no obj外(这个参数意义并不大,所以当前yolo层如果出现nan这个的打印,也是正常的,只是表示当前batch刚好所有图片都是大框或是小框,所以提高batch的数目可以降低nan出现的机率)54643:当前训练的迭代次数0.500140:总体的loss0.547064 avg:平均loss,越小越好,一般低于)0.060730avg就可以0.002000 rate:当前的学习率,cfg文件定义6.243072 secondes:当前批次训练花费的总时间55954432 images:参与训练的总图片数量
日志解析&可视化
- 日志解析
def extract_log(path_log, new_log_file, key_word):
    with open(path_log, 'r') as f:
        with open(new_log_file, 'w') as train_log:
            for line in f:
                if 'Syncing' in line: # 去除多gpu的同步log
                    continue
                if 'nan' in line: # 去除除零错误的log
                    continue
                if key_word in line:
                    train_log.write(line)
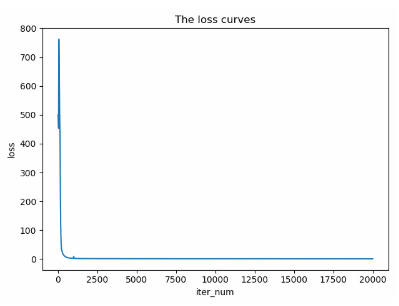
- log可视化(可以设起始和截止点分段看)
def draw_loss(path_loss):
    start = 0
    end = 10000
    with open(path_loss, 'r') as fp:
        info = {'iter_num':[], 'loss':[]}
        for ind, line in enumerate(fp):
            if ind > end:
                continue
            iter_num = int(line.split(',')[0].split(':')[0])
            info['iter_num'].append(iter_num)
            loss = float(line.split(',')[1].split(' ')[1])
            info['loss'].append(loss)
    figure = plt.figure()
    plt.plot(info['iter_num'][start:end], info['loss'][start:end])
    plt.xlabel('iter_num');plt.ylabel('loss');
    plt.title('The loss curves')
    plt.show()
- IOU可视化(可以设起始和截止点分段看)
def draw_iou(path_iou):
    start = 0  # start
    end = 10000	# end
    with open(path_iou, 'r') as fp:
        info = {'Ind':[], 'AvgIOU':[], 'Class':[], 'Obj':[], 'NoObj':[]}
        for ind, line in enumerate(fp):
            # print(line)
            if ind > end:
                continue
            tmp = line.split(',')
            info['Ind'].append(ind)
            info['AvgIOU'].append(float(tmp[0].split(' ')[4]))
            info['Class'].append(float(tmp[1].split(' ')[2]))
            info['Obj'].append(float(tmp[2].split(' ')[2]))
            info['NoObj'].append(float(tmp[3].split(' ')[3]))
    figure = plt.figure()
    plt.subplot(2,2,1)
    plt.plot(info['Ind'][start:end], info['AvgIOU'][start:end], label='AvgIOU', color='k', marker='.')
    plt.title('AvgIOU')

    plt.subplot(2,2,2)
    plt.plot(info['Ind'][start:end], info['Class'][start:end], label='Class', color='r', marker='o')
    plt.title('Class')

    plt.subplot(2,2,3)
    plt.plot(info['Ind'][start:end], info['Obj'][start:end], label='Obj', color='y', marker='1')
    plt.title('Obj')

    plt.subplot(2,2,4)
    plt.plot(info['Ind'][start:end], info['NoObj'][start:end], label='NoObj', color='g', marker='2')
    plt.title('NoObj')

    plt.show()


