效果图如下:
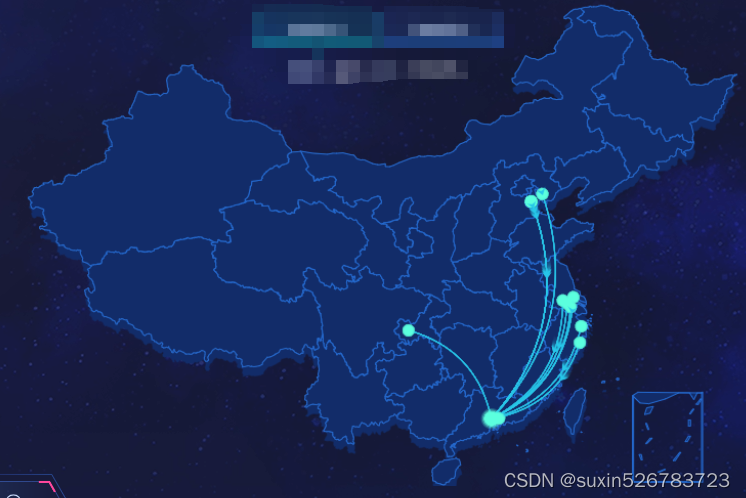
1、首先使用的是:echart4.几版本,需要引入中国地图的json文件
import chinaCityJson from 'echarts/map/json/china.json'2,我这个地图主要有两种类型的点,一个是飞线终点的配置,一个是飞线起点的配置,并且地图做了一个阴影悬浮,所有option里面的series有四个,具体如下
option = {
visualMap: {
show: false,
type: 'continuous',
calculable: true,
left: '0%',
bottom: '3%',
dimension: 0, // 指定用数据的『哪个维度』,映射到视觉元素上。『数据』即 series.data。 可以把 series.data 理解成一个二维数组,其中每个列是一个维度,默认取 data 中最后一个维度
seriesIndex: 1,
itemWidth: 15, // 图形的宽度,即长条的宽度。
itemHeight: 68,
min: 0,
// max: that.mapmax,
// color: ['#01fffd', '#1E74FF'],
// color: ['#0B64F3', '#1A05B8'],
color: ['#007EF9 ', '#0B275E'],
textStyle: {
color: '#ccc',
fontSize: 12
}
},
tooltip: {
// 轮播框
enterable: true,
transitionDuration: 1,
textStyle: {
fontFamily: 'Microsoft YaHei',
color: '#b8c8e5',
fontSize: 13
},
backgroundColor: 'rgba(15,33,70,0.7)',
borderColor: 'rgba(54,82,132,0.7)',
borderWidth: 1,
padding: [10, 14],
extraCssText: 'z-index:4',
formatter: function (parma:any) {
if(parma.seriesType === 'effectScatter') {
return parma.name
} else {
return parma.name
}
}
},
legend: {
show: false,
color: ['#5bffde'],
icon: 'circle', // 只显示小圆点
top: '10.7%',
// bottom: '2.8%',
left: '2%',
itemGap: 22,
itemWidth: 8, // 图例图形宽度
textStyle: {
color: '#ffff',
fontSize: 14,
fontWeight: 'normal',
// align: "left",
padding: [0, 3],
fontFamily: 'Microsoft YaHei'
},
itemHeight: 8 // 改变圆圈大小
},
geo: {
zoom: 1.22, // 缩放比例
top: '11%',
left: '20%',
show: true,
aspectScale: 0.85,
silent: true, // 鼠标事件是否开启
animation: true,
map: 'china',
label: {
normal: {
show: false
},
emphasis: {
show: false
}
},
roam: false, //是否可缩放
// aspectScale: 1, //长宽比
// 这里是重点!!!
regions: [
{
name: '南海诸岛',
itemStyle: {
// 隐藏地图
normal: {
opacity: 0 // 为 0 时不绘制该图形
}
},
label: {
show: false // 隐藏文字
}
}
],
itemStyle: {
normal: {
// areaColor: '#122C69', // #415ef7
borderColor: '#122C69',
shadowColor: '#122C69',
shadowOffsetX: 1,
shadowOffsetY: 9
// borderWidth: 3,
},
emphasis: {
areaColor: '#4499d0'
}
}
},
series: [
{
name: '背景地图',
type: 'effectScatter',
coordinateSystem: 'geo',
symbolSize: function () {
return 8
},
// data: mapData,
data: [],
rippleEffect: {
period: 4,
scale: 1.5,
brushType: 'stroke'
},
label: {
normal: {
formatter: '{b}',
position: 'bottom',
show: false
},
emphasis: {
show: false
}
},
showEffectOn: 'render',
hoverAnimation: true,
itemStyle: {
normal: {
color: '#5bffde' // 点的颜色
},
label: {
show: false
},
// 高亮 鼠标移上去
// emphasis: {
// color: 'red'
// }
},
// select: {
// // 选中
// itemStyle: {
// color: 'yellow'
// }
// },
zlevel: 1
},
{
// 真的地图
type: 'map',
map: 'china',
zoom: 1.22, // 缩放比例
geoIndex: 1,
left: '20%',
top: '11%',
aspectScale: 0.85, // 长宽比
showLegendSymbol: true, // 存在legend时显示
label: {
normal: {
show: false
},
emphasis: {
show: false,
textStyle: {
color: '#fff'
}
}
},
roam: false,
itemStyle: {
normal: {
color: 'none',
areaColor:'#122C69', //'#01032a',
borderColor: '#246BD2', // 4065eb
borderWidth: 1
},
emphasis: {
areaColor: '#34d1fc'
}
},
select: {
// 选中时样式
label: {
color: '#fff'
},
itemStyle: {
areaColor: '#34d1fc'
}
},
animation: true,
data: []
// data: that.maparr
},
{
name: '大网点',
type: 'effectScatter',
coordinateSystem: 'geo',
symbolSize: function () {
return 14
},
data: [
{
name: '当前重点的地址名称',
value: option.value = {
visualMap: {
show: false,
type: 'continuous',
calculable: true,
left: '0%',
bottom: '3%',
dimension: 0, // 指定用数据的『哪个维度』,映射到视觉元素上。『数据』即 series.data。 可以把 series.data 理解成一个二维数组,其中每个列是一个维度,默认取 data 中最后一个维度
seriesIndex: 1,
itemWidth: 15, // 图形的宽度,即长条的宽度。
itemHeight: 68,
min: 0,
// max: that.mapmax,
// color: ['#01fffd', '#1E74FF'],
// color: ['#0B64F3', '#1A05B8'],
color: ['#007EF9 ', '#0B275E'],
textStyle: {
color: '#ccc',
fontSize: 12
}
},
tooltip: {
// 轮播框
enterable: true,
transitionDuration: 1,
textStyle: {
fontFamily: 'Microsoft YaHei',
color: '#b8c8e5',
fontSize: 13
},
backgroundColor: 'rgba(15,33,70,0.7)',
borderColor: 'rgba(54,82,132,0.7)',
borderWidth: 1,
padding: [10, 14],
extraCssText: 'z-index:4',
formatter: function (parma:any) {
if(parma.seriesType === 'effectScatter') {
return parma.name
} else {
return parma.name
}
}
},
legend: {
show: false,
color: ['#5bffde'],
icon: 'circle', // 只显示小圆点
top: '10.7%',
// bottom: '2.8%',
left: '2%',
itemGap: 22,
itemWidth: 8, // 图例图形宽度
textStyle: {
color: '#ffff',
fontSize: 14,
fontWeight: 'normal',
// align: "left",
padding: [0, 3],
fontFamily: 'Microsoft YaHei'
},
itemHeight: 8 // 改变圆圈大小
},
geo: {
zoom: 1.22, // 缩放比例
top: '11%',
left: '20%',
show: true,
aspectScale: 0.85,
silent: true, // 鼠标事件是否开启
animation: true,
map: 'china',
label: {
normal: {
show: false
},
emphasis: {
show: false
}
},
roam: false, //是否可缩放
// aspectScale: 1, //长宽比
// 这里是重点!!!
regions: [
{
name: '南海诸岛',
itemStyle: {
// 隐藏地图
normal: {
opacity: 0 // 为 0 时不绘制该图形
}
},
label: {
show: false // 隐藏文字
}
}
],
itemStyle: {
normal: {
// areaColor: '#122C69', // #415ef7
borderColor: '#122C69',
shadowColor: '#122C69',
shadowOffsetX: 1,
shadowOffsetY: 9
// borderWidth: 3,
},
emphasis: {
areaColor: '#4499d0'
}
}
},
series: [
{
name: '接单网点',
type: 'effectScatter',
coordinateSystem: 'geo',
symbolSize: function () {
return 8
},
// data: mapData,
data: [],
rippleEffect: {
period: 4,
scale: 1.5,
brushType: 'stroke'
},
label: {
normal: {
formatter: '{b}',
position: 'bottom',
show: false
},
emphasis: {
show: false
}
},
showEffectOn: 'render',
hoverAnimation: true,
itemStyle: {
normal: {
color: '#5bffde' // 点的颜色
},
label: {
show: false
},
// 高亮 鼠标移上去
// emphasis: {
// color: 'red'
// }
},
// select: {
// // 选中
// itemStyle: {
// color: 'yellow'
// }
// },
zlevel: 1
},
{
// 真的地图
type: 'map',
map: 'china',
zoom: 1.22, // 缩放比例
geoIndex: 1,
left: '20%',
top: '11%',
aspectScale: 0.85, // 长宽比
showLegendSymbol: true, // 存在legend时显示
label: {
normal: {
show: false
},
emphasis: {
show: false,
textStyle: {
color: '#fff'
}
}
},
roam: false,
itemStyle: {
normal: {
color: 'none',
areaColor:'#122C69', //'#01032a',
borderColor: '#246BD2', // 4065eb
borderWidth: 1
},
emphasis: {
areaColor: '#34d1fc'
}
},
select: {
// 选中时样式
label: {
color: '#fff'
},
itemStyle: {
areaColor: '#34d1fc'
}
},
animation: true,
data: []
// data: that.maparr
},
{
name: '网点',
type: 'effectScatter',
coordinateSystem: 'geo',
symbolSize: function () {
return 14
},
data: [
{
name: '终点名称-广东',
value: ['113.746262', '23.046237'] // 当前终点的经纬度
}
],
rippleEffect: {
period: 4,
scale: 1.5,
brushType: 'stroke'
},
label: {
normal: {
formatter: '{b}',
position: 'bottom',
show: false
},
emphasis: {
show: false
}
},
showEffectOn: 'render',
hoverAnimation: true,
itemStyle: {
normal: {
color: '#5bffde' // 点的颜色
},
label: {
show: false
},
// 高亮 鼠标移上去
// emphasis: {
// color: 'red'
// }
},
// select: {
// // 选中
// itemStyle: {
// color: 'yellow'
// }
// },
zlevel: 2
},
{
type: 'lines',
zlevel: 1,
effect: {
show: true,
period: 6, //箭头指向速度,值越小速度越快
trailLength: 0.02, //特效尾迹长度[0,1]值越大,尾迹越长重
symbol: 'arrow', //箭头图标
symbolSize: 6 //图标大小
},
label: {
emphasis: {
show: false
}
},
lineStyle: {
normal: {
width: 1, //尾迹线条宽度
color: '#27C7E9',
opacity: 1, //尾迹线条透明度
curveness: 0.3 //尾迹线条曲直度
}
},
data: []
}
]
}
}
],
rippleEffect: {
period: 4,
scale: 1.5,
brushType: 'stroke'
},
label: {
normal: {
formatter: '{b}',
position: 'bottom',
show: false
},
emphasis: {
show: false
}
},
showEffectOn: 'render',
hoverAnimation: true,
itemStyle: {
normal: {
color: '#5bffde' // 点的颜色
},
label: {
show: false
},
// 高亮 鼠标移上去
// emphasis: {
// color: 'red'
// }
},
// select: {
// // 选中
// itemStyle: {
// color: 'yellow'
// }
// },
zlevel: 2
},
{
type: 'lines',
zlevel: 1,
effect: {
show: true,
period: 6, //箭头指向速度,值越小速度越快
trailLength: 0.02, //特效尾迹长度[0,1]值越大,尾迹越长重
symbol: 'arrow', //箭头图标
symbolSize: 6 //图标大小
},
label: {
emphasis: {
show: false
}
},
lineStyle: {
normal: {
width: 1, //尾迹线条宽度
color: '#27C7E9',
opacity: 1, //尾迹线条透明度
curveness: 0.3 //尾迹线条曲直度
}
},
data: [
[
{ // 第一个起点的经纬度配置
coord:['119.946973', '31.772752'],
value: "0000100101"
},
{
coord: ['113.746262', '23.046237'] // 跟上面的广东那一层的经纬度对应
}
],
[
{ // 第二个起点的经纬度配置
coord:['119.946973', '31.772752'],
value: "0000100101"
},
{
coord: ['113.746262', '23.046237'] // 跟上面的广东那一层的经纬度对应
}
]
// ......
]
}
]
}如果只需要一层地图,就去掉阴影那层就行了,只需要飞行在同一层里面,也可以相对调整一下,
接下来就是一定要注册地图,不然中国地图不显示哦
// 地图注册,第一个参数的名字必须和option.geo.map一致

  echarts.registerMap('china', chinaCityJson)
  myChart.setOption(option, true)
就这样完成啦!