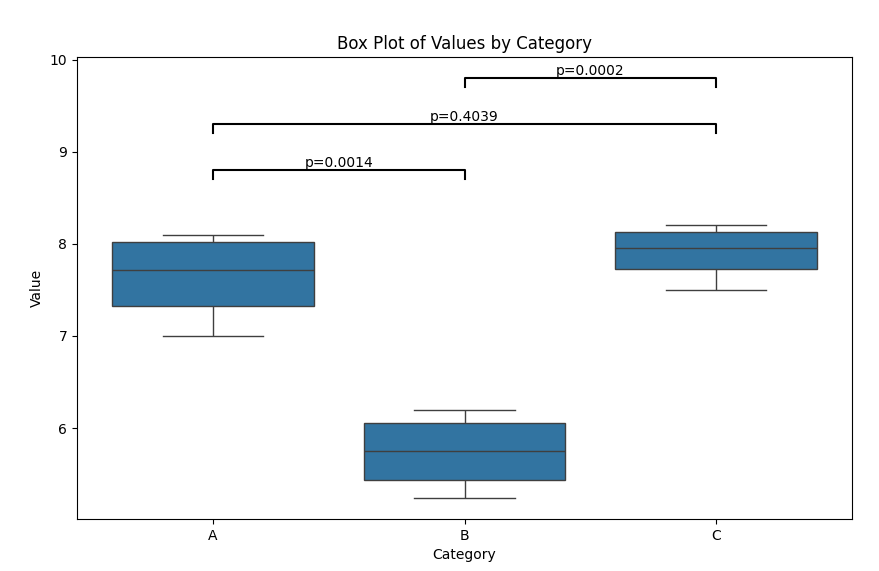
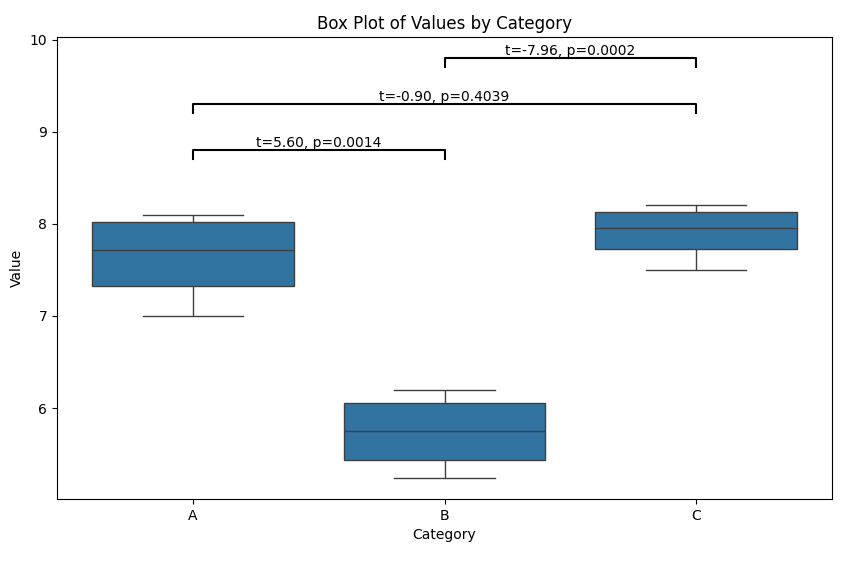
1. 两两之间的检验差异
为了标注不同分类情况下两两之间的检验差异,我们可以使用统计检验方法,如 t-检验 或者 Mann-Whitney U 检验。这些方法可以帮助我们确定不同分类之间的差异是否具有统计学意义。
t-检验 和 Mann-Whitney U 检验 都是统计学中用来比较两个组别之间是否存在显著差异的假设检验方法,但它们适用于不同的数据类型和前提条件。
1.1 t-检验 (T-Test)
t-检验 主要用于比较两组数据的均值是否具有显著性差异,尤其是当这两组数据来自正态分布且方差相等的总体时。t-检验有几种类型,包括:
1 ) 单样本 t-检验:用于检验一组数据的均值与已知总体均值是否有显著差异。
2 ) 配对样本 t-检验(也称作相关样本 t-检验):用于检验同一组对象在两种不同条件下的测量值是否有显著差异。
3 ) 独立样本 t-检验(也称作两样本 t-检验):用于检验两组独立样本的均值是否有显著差异。
t-检验 的基本假设是数据服从正态分布,且在独立样本t-检验中还假设两组数据的方差相同。如果这些假设不成立,则 t-检验的结果可能不可靠。
1.2 Mann-Whitney U 检验 (Mann-Whitney U Test)
Mann-Whitney U 检验 是一种非参数检验方法,用于比较两个独立样本的分布是否相同。与 t-检验不同,Mann-Whitney U 检验不需要假设数据服从正态分布,因此适用于数据不服从正态分布的情况。它主要通过比较两个样本的秩(即排序后的顺序位置)来判断两个样本是否来自同一个总体。
Mann-Whitney U 检验主要用于以下情况:
- 数据不符合正态分布。
- 数据是序数型(例如满意度评分)。
- 数据中有许多异常值或极端值。
1.3 总结
- t-检验 更适合于数据符合正态分布的情况。
- Mann-Whitney U 检验 则适用于数据不符合正态分布或其他非参数条件下。
选择哪种检验方法取决于你的数据特性和研究目的。如果你的数据满足正态分布的前提条件,那么使用 t-检验可能是更好的选择;如果数据不符合这些前提条件,或者你更关心的是两个样本的分布是否相同而不是均值的差异,那么 Mann-Whitney U 检验可能更适合。
2. 代码实现
假设你有一个数据集,其中包含多个分类(例如 A、B、C),每个分类有多个数值。我们将使用 Python 的 scipy.stats 模块来进行统计检验,并使用 pandas 来处理数据。
2.1 Mann-Whitney U 检验
import pandas as pd
import numpy as np
import matplotlib.pyplot as plt
import seaborn as sns
from scipy.stats import ttest_ind, mannwhitneyu

# 示例数据
data = {
    'Category': ['A', 'A', 'A', 'A', 'B', 'B', 'B', 'B', 'C', 'C', 'C', 'C'],
    'Value': [7.43, 8, 7, 8.09, 5.24, 6, 5.5, 6.2, 7.8, 8.2, 7.5, 8.1]
}

# 创建 DataFrame
df = pd.DataFrame(data)

# 提取不同类别的数据
categories = df['Category'].unique()
category_data = {cat: df[df['Category'] == cat]['Value'] for cat in categories}

# 进行两两之间的 t-检验
results = {}
for i, cat1 in enumerate(categories):
    for j, cat2 in enumerate(categories):
        if i < j:
            t_stat, p_value = ttest_ind(category_data[cat1], category_data[cat2])
            results[(cat1, cat2)] = {'t-statistic': t_stat, 'p-value': p_value}

# 绘制箱线图
plt.figure(figsize=(10, 6))
sns.boxplot(x='Category', y='Value', data=df)
plt.title('Box Plot of Values by Category')

# 添加统计检验结果
y_max = df['Value'].max() + 0.5
for (cat1, cat2), result in results.items():
    p_value = result['p-value']
    x1 = categories.tolist().index(cat1)
    x2 = categories.tolist().index(cat2)
    mid_x = (x1 + x2) / 2
    height = y_max
    y_max += 0.5  # 增加高度,避免标签重叠
    plt.plot([x1, x1, x2, x2], [height, height + 0.1, height + 0.1, height], lw=1.5, c='k')
    plt.text(mid_x, height + 0.1, f'p={p_value:.4f}', ha='center', va='bottom', color='k')

plt.show()
2.2 t-检验
import pandas as pd
import matplotlib.pyplot as plt
import seaborn as sns
from scipy.stats import ttest_ind

# 示例数据
data = {
    'Category': ['A', 'A', 'A', 'A', 'B', 'B', 'B', 'B', 'C', 'C', 'C', 'C'],
    'Value': [7.43, 8, 7, 8.09, 5.24, 6, 5.5, 6.2, 7.8, 8.2, 7.5, 8.1]
}

# 创建 DataFrame
df = pd.DataFrame(data)

# 提取不同类别的数据
categories = df['Category'].unique()
category_data = {cat: df[df['Category'] == cat]['Value'] for cat in categories}

# 进行两两之间的 t-检验
results = {}
for i, cat1 in enumerate(categories):
    for j, cat2 in enumerate(categories):
        if i < j:
            t_stat, p_value = ttest_ind(category_data[cat1], category_data[cat2])
            results[(cat1, cat2)] = {'t-statistic': t_stat, 'p-value': p_value}

# 绘制箱线图
plt.figure(figsize=(10, 6))
sns.boxplot(x='Category', y='Value', data=df)
plt.title('Box Plot of Values by Category')

# 添加统计检验结果
y_max = df['Value'].max() + 0.5
for (cat1, cat2), result in results.items():
    t_stat = result['t-statistic']
    p_value = result['p-value']
    x1 = categories.tolist().index(cat1)
    x2 = categories.tolist().index(cat2)
    mid_x = (x1 + x2) / 2
    height = y_max
    y_max += 0.5  # 增加高度,避免标签重叠
    plt.plot([x1, x1, x2, x2], [height, height + 0.1, height + 0.1, height], lw=1.5, c='k')
    plt.text(mid_x, height + 0.1, f't={t_stat:.2f}, p={p_value:.4f}', ha='center', va='bottom', color='k')

plt.show()

