我想能够在excel中控制背景单元格的颜色。我有大量的数据,我需要确定数据是否符合预期。我已经可以用Python完成了。但是,我想在excel中显示这些数据,为了便于阅读,我想根据数据的好坏给单元格上色。在
我已经使用style.applymap根据特定的单元格值为单元格指定颜色。例如,如果手机显示“失败”,那么我可以把它涂成红色。在
因此,如果我仔细检查数据,创建一个新的“通过”/“不通过”列表,并将这些值输入到excel文档中,我就可以得到我想要的颜色。下面显示了这段代码,我可以得到类似于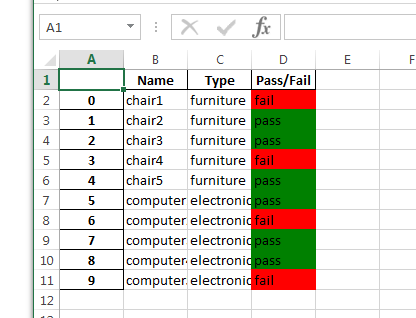
但是,如果我想在单元格中输入实际值,那么我不知道如何获得我想要的背景颜色。在
到目前为止我所拥有的:import pandas as pd
#in the example, I have a list of office items, chairs and computers
names=['chair1','chair2','chair3','chair4','chair5','computer1','computer2','computer3','computer4','computer5']
#Each name has an assigned type. The type determines what the expectations are for the lifetime
inv_type=['furniture&#