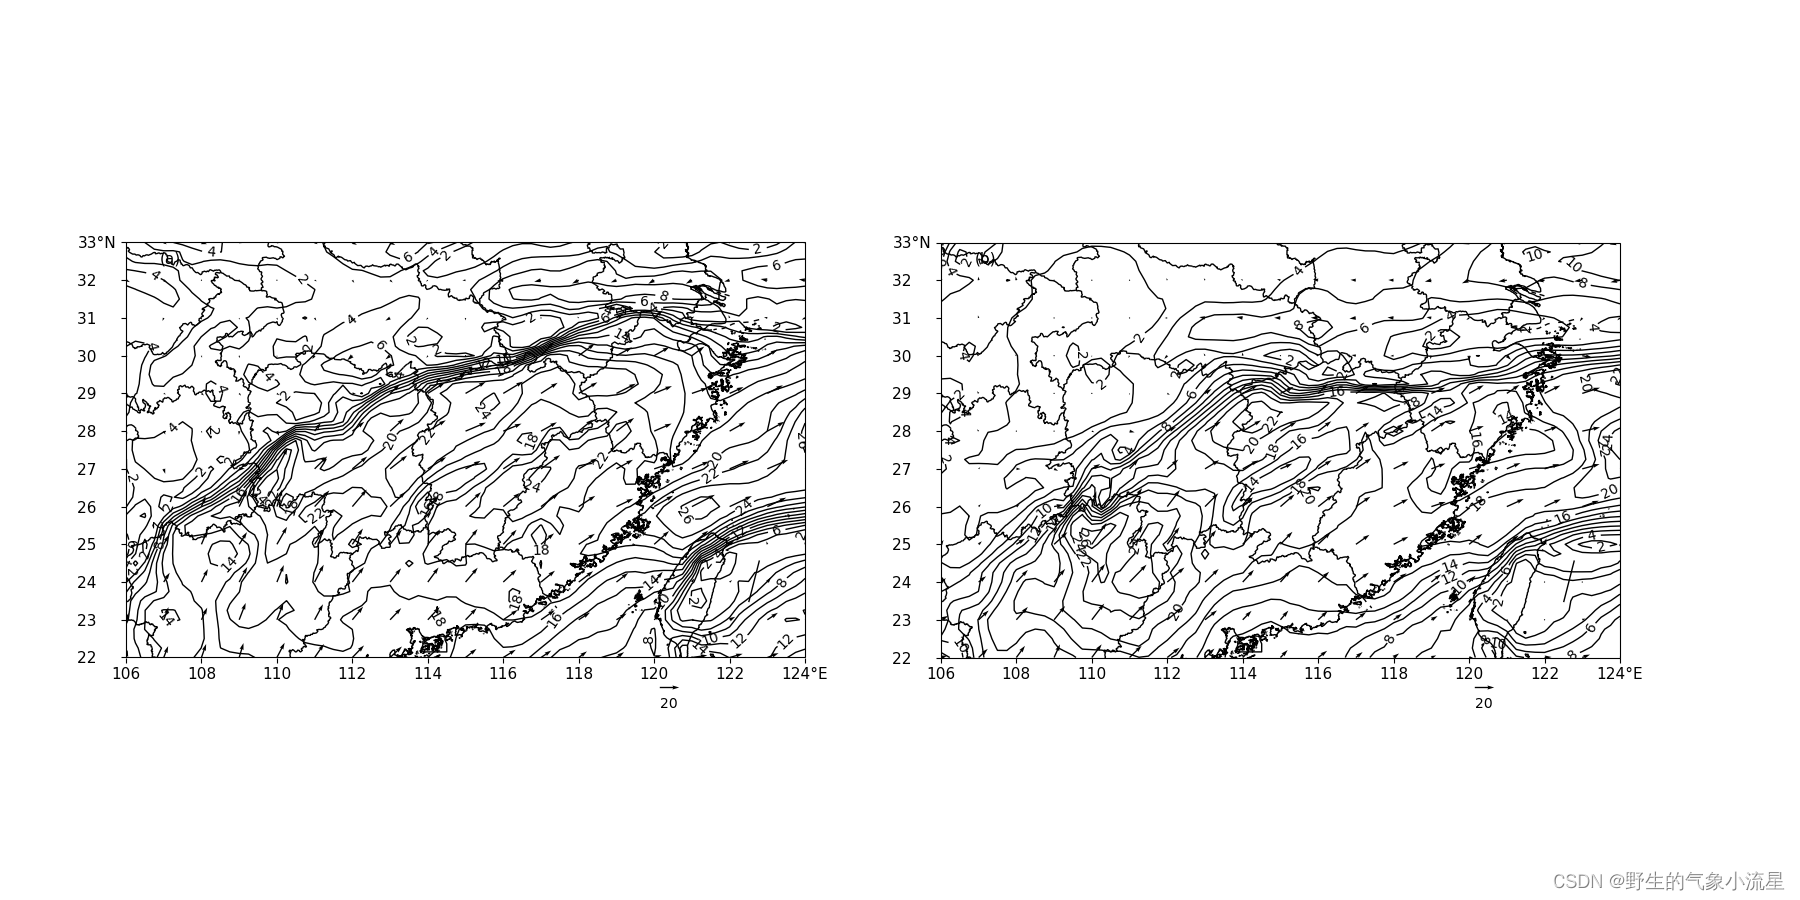
一、知识点
计算水汽通量,用到了metpy包,是一个地球科学计算包,内置了很多气象用到的计算函数
小知识点:
1.用湿度计算比湿
2.单位的使用
3.常量的使用,这里涉及了重力加速度g
二、代码拆分
导入包
#处理数据的包
import xarray as xr
import numpy as np
#画图的包
import matplotlib.pyplot as plt
#地图的包
import cartopy.crs as ccrs
import my_class                   #一个自己写的画地图的py文件
#科学计算的包
from metpy.units import units      #里面是单位
import metpy.constants          #里面是常数
import metpy.calc                #里面有各种计算函数
读取数据
ds = xr.open_dataset('download_201306.nc')#用xarray读取NC数据
lat = ds.latitude#读取维度
lon = ds.longitude#读取经度
time = ds.time#读取时间
u = ds['u']#风场U分量
v = ds['v']#风场V分量
tem = ds['t']- 273.15#读取温度,转化为摄氏度
rh = ds['r']#读取湿度
注意:这里读取的数据是全部的格点数据,但是我们画图用不了这么多,所以对数据做分割。只需要一部分
数据筛选分割
#设置经纬度范围
lat_range = lat[(lat>=22) & (lat<=33)]
lon_range = lon[(lon>=106) & (lon<=124)]
#筛选数据(经纬度,时间)
u_region = u.sel(longitude=lon_range, latitude=lat_range,time = '2013-06-28T00:00:00.000000000')
v_region = v.sel(longitude=lon_range, latitude=lat_range,time = '2013-06-28T00:00:00.000000000')
tem_region = tem.sel(longitude=lon_range, latitude=lat_range,time = '2013-06-28T00:00:00.000000000')
rh_region = rh.sel(longitude=lon_range, latitude=lat_range,time = '2013-06-28T00:00:00.000000000')
上面获得了世界时2013年6月28日00时的UV风场、温度、湿度
这里解释一下,作者下载的在分析资料里没有分层的数据,只下载了850hPa一层数据,所以不需要设置高度。
数据计算
#给温度赋予单位摄氏度,正真意义上的摄氏度,metpy有单位体系
tem_region = tem_region * units.degC
#气压赋予hPa
pressure = 850 * units.hPa
#用相对湿度和温度计算露点,函数名字就是字面意思
dewpoint = metpy.calc.dewpoint_from_relative_humidity(tem_region, rh_region)
#用露点和气压算比湿,函数名字就是字面意思,因为计算结果是kg数值,乘以1000变成克
specific_humidity = metpy.calc.specific_humidity_from_dewpoint(pressure, dewpoint)*1000
#计算两个方向上的水汽通量,公式就是  速度*比湿/重力加速度
qu = u_region * specific_humidity / metpy.constants.g
qv = v_region * specific_humidity / metpy.constants.g
#和风速一样,勾股定理就得到了水汽通量的分布数值,为啥这么麻烦呢,因为UV分量一会儿还要画箭头
a = np.sqrt(qu * qu + qv*qv)
这里的知识点:
1.温度和气压赋予单位,因为metpy的计算是有单位体系的
2.利用metpy.calc的内置函数计算物理量
dewpoint_from_relative_humidity:露点_from_相对湿度,参数是温度和湿度
specific_humidity_from_dewpoint:比湿_from_露点,参数是气压和露点。
3.利用水汽通量公式:速度*比湿/重力加速度计算水汽通量的UV分量。
画图设置
#画布
fig = plt.figure(figsize=(9,6))
#子图
ax = fig.add_subplot(111,projection = ccrs.PlateCarree())
ax.set_extent([106, 124, 22, 33])
ax.set_xticks(np.arange(106,125,2),crs=ccrs.PlateCarree())
ax.set_yticks(np.arange(22,34,1),crs=ccrs.PlateCarree())
xticks_str = ['106', '108', '110', '112', '114', '116', '118','120', '122', '124°E']
ax.set_xticklabels(xticks_str,fontsize = 11)
yticks_str = ['22   ','23    ','24    ','25    ','26    ','27    ','28    ','29    ','30    ','31    ','32    ','33°N']
ax.set_yticklabels(yticks_str,fontsize = 11)
my_class.readshapefile('bou2_4l.shp',linewidth=1,ax=ax)
画图设置这里就不多讲了,就是弄个画布、弄个子图,设置一下XY轴,加载个地图。
画图
#画水汽通量等值线
ct=ax.contour(lon_range,lat_range,a,8,colors='k',linewidths=1,levels=range(0,28,2))
ax.clabel(ct,inline=True,fontsize=10,fmt='%.0f')
#下面画箭头
#获得XY矩阵格式坐标,这里对纬度上的格点进行了处理,降尺度,从0.25变成了1,其实就是间隔4取值,目的是因为箭头太密影响效果
h1 = ax.quiver(lon_range[::4],lat_range[::4],qu[::4,::4],qv[::4,::4],     #X,Y,U,V 确定位置和对应的风速
                width = 0.002, #箭杆箭身宽度
                scale = 700, # 箭杆长度,参数scale越小箭头越长
                pivot = 'tail'#箭头的其实位置,这里表示从点起,还有点在中心的‘mid’
                )

#画出风场,和箭头箭轴后,得说明 箭轴长度与风速的对应关系
#调用quiver可以生成 参考箭头 + label。
ax.quiverkey(h1,                      #传入quiver句柄
              X=0.8, Y = -0.07,       #确定 label 所在位置,都限制在[0,1]之间
              U = 20,                    #参考箭头长度 表示20。
              angle = 0,            #参考箭头摆放角度。默认为0,即水平摆放
             label='20',        #箭头的补充:label的内容  +
             labelpos='S',          #label在参考箭头的哪个方向; S表示南边
             color = 'k',labelcolor = 'k', #箭头颜色 + label的颜色
             )
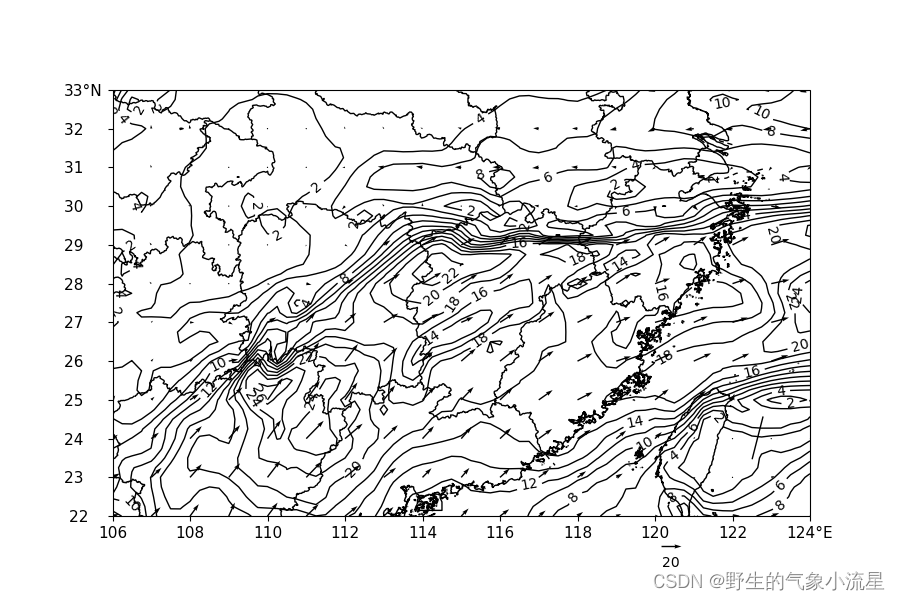
这里画了一个等值线,画了一个水汽通量的方向场,其实就是画风场的方法。
出图
plt.show()
三、完整代码
这里的完整代码是两张图,包含了一个循环,就是把两个时次的图放在一起。
'''
知识点:计算水汽通量,用到了metpy包,是一个地球科学计算包,内置了很多气象用到的计算函数
小知识点:1.用湿度计算比湿
          2.单位的使用
          3.常量的使用,这里涉及了重力加速度g
'''
#处理数据的包
import xarray as xr
import numpy as np
#画图的包
import matplotlib.pyplot as plt
#地图的包
import cartopy.crs as ccrs
import my_class
#科学计算的包
from metpy.units import units      #里面是单位
import metpy.constants          #里面是常数
import metpy.calc                #里面有各种计算函数


#循环的东西这里就不讲解了
ds = xr.open_dataset('download_201306.nc')
lat = ds.latitude
lon = ds.longitude
time = ds.time
u = ds['u']
v = ds['v']
tem = ds['t']- 273.15#温度变成摄氏度
rh = ds['r']#湿度


lat_range = lat[(lat>=22) & (lat<=33)]
lon_range = lon[(lon>=106) & (lon<=124)]
fig = plt.figure(figsize=(18,9))

#设置2个子图,并且放到列表里面,方便循环的时候用
plt.subplots_adjust(left=0.07, right=0.90, top=0.95, bottom=0.05,wspace=0.2,hspace=0.1)
ax_a = fig.add_subplot(1,2,1,projection = ccrs.PlateCarree())
ax_b = fig.add_subplot(1,2,2,projection = ccrs.PlateCarree())


ax_list = [ax_a,ax_b]
ab = ['(a)','(b)']#图右上角的ab
i = 0#循环变量

for time_i in time:
    #风U
    u_region = u.sel(longitude=lon_range, latitude=lat_range,time = time_i)
    #风V
    v_region = v.sel(longitude=lon_range, latitude=lat_range,time = time_i)
    #温度
    tem_region = tem.sel(longitude=lon_range, latitude=lat_range,time = time_i)
    #湿度
    rh_region = rh.sel(longitude=lon_range, latitude=lat_range,time = time_i)
    #给温度赋予单位摄氏度,正真意义上的摄氏度,metpy有单位体系
    tem_region = tem_region * units.degC
    #气压赋予hPa
    pressure = 850 * units.hPa
    #用相对湿度和温度计算露点,函数名字就是字面意思
    dewpoint = metpy.calc.dewpoint_from_relative_humidity(tem_region, rh_region)
    #用露点和气压算比湿,函数名字就是字面意思,因为计算结果是kg数值,乘以1000变成克
    specific_humidity = metpy.calc.specific_humidity_from_dewpoint(pressure, dewpoint)*1000
    #计算两个方向上的水汽通量,公式就是  速度*比湿/重力加速度
    qu = u_region * specific_humidity / metpy.constants.g
    qv = v_region * specific_humidity / metpy.constants.g
    #和风速一样,勾股定理就得到了水汽通量的分布数值,为啥这么麻烦呢,因为UV分量一会儿还要画箭头
    a = np.sqrt(qu * qu + qv*qv)


    ax_list[i].set_extent([106, 124, 22, 33])
    ax_list[i].set_xticks(np.arange(106,125,2),crs=ccrs.PlateCarree())
    ax_list[i].set_yticks(np.arange(22,34,1),crs=ccrs.PlateCarree())
    xticks_str = ['106', '108', '110', '112', '114', '116', '118','120', '122', '124°E']
    ax_list[i].set_xticklabels(xticks_str,fontsize = 11)
    yticks_str = ['22    ','23    ','24    ','25    ','26    ','27    ','28    ','29    ','30    ','31    ','32    ','33°N']
    ax_list[i].set_yticklabels(yticks_str,fontsize = 11)
    my_class.readshapefile('bou2_4l.shp',linewidth=1,ax=ax_list[i])


    #画等值线
    ct=ax_list[i].contour(lon_range,lat_range,a,8,colors='k',linewidths=1,levels=range(0,28,2))
    ax_list[i].clabel(ct,inline=True,fontsize=10,fmt='%.0f')


    #下面画箭头
    #获得XY矩阵格式坐标,这里对纬度上的格点进行了处理,降尺度,从0.25变成了1,其实就是间隔4取值,目的是因为箭头太密影响效果
    h1 = ax_list[i].quiver(lon_range[::4],lat_range[::4],qu[::4,::4],qv[::4,::4],     #X,Y,U,V 确定位置和对应的风速
                    width = 0.002, #箭杆箭身宽度
                    scale = 700, # 箭杆长度,参数scale越小箭头越长
                    pivot = 'tail'#箭头的其实位置,这里表示从点起,还有点在中心的‘mid’
                    )

    #画出风场,和箭头箭轴后,得说明 箭轴长度与风速的对应关系
    #调用quiver可以生成 参考箭头 + label。
    ax_list[i].quiverkey(h1,                      #传入quiver句柄
                  X=0.8, Y = -0.07,       #确定 label 所在位置,都限制在[0,1]之间
                  U = 20,                    #参考箭头长度 表示风速为5m/s。
                  angle = 0,            #参考箭头摆放角度。默认为0,即水平摆放
                 label='20',        #箭头的补充:label的内容  +
                 labelpos='S',          #label在参考箭头的哪个方向; S表示南边
                 color = 'k',labelcolor = 'k', #箭头颜色 + label的颜色
                 )

    #写abcd
    ax_list[i].text(0.05, 0.95, ab[i],transform=ax_list[i].transAxes, fontsize=11)

    #一次循环结束 i+1
    i += 1


plt.show()
