matlab帮助中心:
https://ww2.mathworks.cn/help/matlab/ref/plot.html?searchHighlight=plot&s_tid=srchtitle_plot_1
https://ww2.mathworks.cn/help/matlab/ref/xlabel.html?s_tid=doc_ta
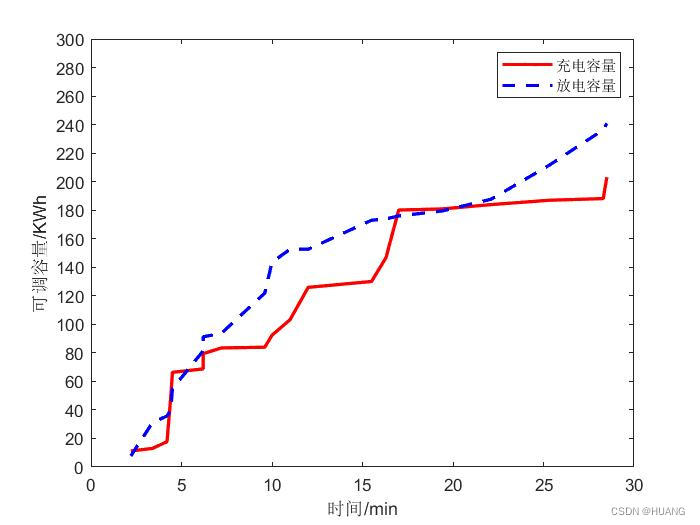
a=table2array(data( : ,1));    %横坐标   %直接从excel导入的格式是table plot函数不可以用
b=table2array(data( : ,2));    %纵坐标1
c=table2array(data( : ,3));    %纵坐标2

plot(a,b,'-r','LineWidth',2);%还可以调整线形,颜色等
hold on;
%不知道为啥,要是写一个plot(a,b,'-r','LineWidth',2,a,c,'--b','LineWidth',2);会报错,于是就分开写了
plot(a,c,'--b','LineWidth',2);%线宽默认是1
xlabel('时间/min');
%可以调整坐标的位置'position',[1,1]
%ylabel('y轴名称','fontsi',20,'position',[1,1]);
ylabel('可调容量/KWh');
axis([0,30,0,300])  %确定x轴与y轴框图大小
set(gca,'XTick',[0:5:30]) %x轴范围1-6,间隔1
set(gca,'YTick',[0:20:300]) %y轴范围0-700,间隔100
legend('充电容量','放电容量');   %右上角标注
最终运行得到折线图;