Series:一维数组
import pandas as pd
ob1=pd.Series([10,20,30,40])
ob1.index   '''访问索引‘’‘
ob1.values   ’‘’访问值'''
ob2=pd.Series([10,20,30,40],index=["a","b","c","d"])   '''指定索引'''

ob1.describe()  '''一维数组的描述性统计结果‘’‘

ob1.to_dict()   '''一维数组转化为字典形式’‘’
Dataframe:二维的表格型数据结构(可以理解为Series的容器,也就是说,在Dataframe中,多个Series共用了一个索引)
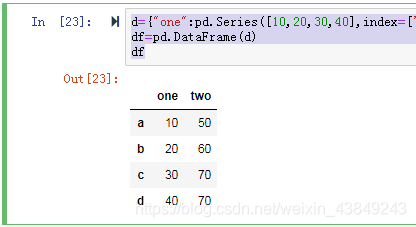
d={"one":pd.Series([10,20,30,40],index=['a','b','c','d']),"two":pd.Series([50,60,70,70],index=["a","b","c","d"])}
df=pd.DataFrame(d)
df
Pandas输出设置:pd.set_option
具体参数参考:https://blog.csdn.net/weixin_34223655/article/details/93524107
import pandas as pd
pd.set_option("display.max_rows",1000)
pd.set_option("display.max_columns",20)
pd.set_option("precision",7)
pd.set_option("large_repr","truncate")
Pandas数据读取与写入:
(1)读取
f=open("E://《Python与量化投资-从理论到实战》 代码//chapter3//closeprice.csv")
a=pd.read_csv(f,encoding='utf-8',dtype={'ticket':str})
a
(2)写入:可使用to_,将DataFrame写入文件

a.to_excel("E://《Python与量化投资-从理论到实战》 代码//chapter3//closeprice.xls")