<template>
<div>
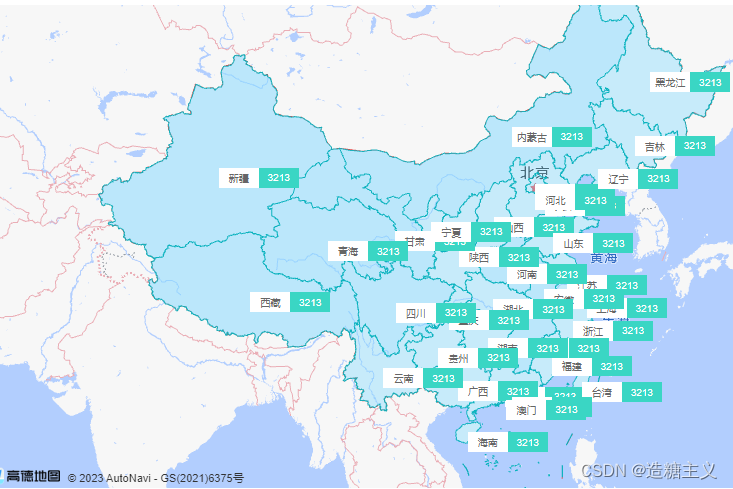
<div id="container" />
<div @click="showFn">显示</div>
<div @click="removeFn">移除</div>
</div>
</template>
<script>
import AMapLoader from '@amap/amap-jsapi-loader'
import chinaData from './provincialData/中华人民共和国.json'
export default {
data() {
return {
map: null,
infoWindow: null,
markers: [],
provincPolygonList: []
}
},
async mounted() {
await this.initMap()
// 初始完地图后,开始绘制
await this.setUpPlotsFn(chinaData)
},
methods: {
/** 1. 初始化地图 **/
initMap() {
return new Promise((resolve) => {
window._AMapSecurityConfig = {
securityJsCode: '你的安全密钥' // 自2021年12月02日升级后, key与安全密钥必须一起使用, 否则可能会出现一些API无法使用,如 DistrictSearch
}
AMapLoader.load({
key: '你的安全密钥key', // 首次调用 load 时必填
version: '2.0', // 指定要加载的 JSAPI 的版本,缺省时默认为 1.4.15
plugins: [
'AMap.DistrictSearch', // 配置行政区查询服务
'AMap.GeoJSON' // 配置行政区查询服务
] // 需要使用的的插件列表,如比例尺'AMap.Scale'等
})
.then((AMap) => {
this.map = new AMap.Map('container', {
center: [116.30946, 39.937629],
zoom: 3
})
this.map.on('complete', () => {
resolve()
})
})
.catch((e) => {
console.log(e)
})
})
},
// 设置地块
setUpPlotsFn(featuresObj) {
const { features } = featuresObj
features.forEach((item) => {
this.addGeoJsonFn(item)
})
this.map.add(this.provincPolygonList)
this.map.add(this.markers)
// 地图自适应
this.map.setFitView()
},
// GeoJson数据进行解析
addGeoJsonFn(feature) {
const geoJSON = {
type: 'FeatureCollection',
features: [feature]
}
this.map.plugin('AMap.Geocoder', () => {
const polygon = new window.AMap.GeoJSON({
geoJSON: geoJSON,
getPolygon: function(geojson, lnglats) {
// 将解析出来的面 进行绘制
return new window.AMap.Polygon({
path: lnglats,
fillOpacity: 0.4,
fillColor: '#80d8ff',
strokeColor: '#08B2BD',
strokeWeight: 1,
map: this.map
})
}
})
const { name, centroid } = feature.properties
console.log('🚀 ~ file: MapConnentNewLast.vue:89 ~ this.map.plugin ~ feature.properties:', feature.properties)
polygon.on('mouseover', (e) => {
// 鼠标移入更改样式
polygon.setOptions({
fillOpacity: 0.7,
fillColor: '#08B2BD'
})
const info = []
info.push(
`<div style="font-size: 12px; background-color: #fff;padding: 10px; border-radius: 10px;"><div style="font-weight: 700;">${name}</div>`
)
info.push(
'<div style="display: flex; justify-content: space-between;align-items: center;padding: 4px 0;"><span style="color:#666;padding-right: 10px;">聚合资源总量</span> <span style="font-weight: 700;">100MW</span></div>'
)
info.push(
'<div style="display: flex; justify-content: space-between;align-items: center;padding: 4px 0;"><span style="color:#666;">充电站</span> <span style="font-weight: 700;">100座</span></div>'
)
info.push(
'<div style="display: flex;justify-content: space-between;align-items: center;padding: 4px 0;"><span style="color:#666;">换电站</span> <span style="font-weight: 700;">100座</span></div>'
)
info.push(
'<div style="display: flex;justify-content: space-between;align-items: center;padding: 4px 0;"><span style="color:#666;">光伏</span> <span style="font-weight: 700;">100MW</span></div>'
)
info.push(
'<div style="display: flex; justify-content: space-between;align-items: center;padding: 4px 0;"><span style="color:#666;">储能</span> <span style="font-weight: 700;">100MWH</span></div></div>'
)
this.infoWindow = new window.AMap.InfoWindow({
isCustom: true, // 使用自定义窗体
content: info.join(''),
offset: new window.AMap.Pixel(0, -30)
})
// 获取点击的位置信息
const lnglat = e.lnglat
// 在点击的位置上显示信息窗体
this.infoWindow.open(this.map, lnglat)
})
polygon.on('mouseout', () => {
// 鼠标移出恢复样式
this.infoWindow.close()
polygon.setOptions({
fillOpacity: 0.5,
fillColor: '#80d8ff'
})
})
this.provincPolygonList.push(polygon)
const center = this.$turf.centroid(geoJSON).geometry.coordinates
console.log('🚀 ~ file: MapConnentNewLast.vue:138 ~ this.map.plugin ~ center:', center)
if (name) {
this.addMarkerList(centroid || center, name)
}
})
},
addMarkerList(center, item) {
const markersContent = []
markersContent.push(`<div style="display: flex;align-items: center;font-size: 10px;border-radius: 4px;">`)
markersContent.push(
`<span style="color:#666;background-color: #fff;min-width: 40px;height: 20px;display: flex;align-items: center;justify-content:center">${item}</span>`
)
markersContent.push(
`<span style="color:#fff;background-color: #3AD6C4;min-width: 40px;height: 20px;display: flex;align-items: center;justify-content:center">3213</span>`
)
markersContent.push(`</div>`)
const marker = new window.AMap.Marker({
position: center, // 标注点位置
content: markersContent.join(''),
map: this.map // 将标注点添加到地图上
})
this.markers.push(marker)
},
// 隐藏
removeFn() {
if (this.markers) {
this.markers.forEach((item) => item.hide())
this.provincPolygonList.forEach((item) => item.hide(item))
}
},
// 隐藏
showFn() {
if (this.markers) {
this.markers.forEach((item) => item.show())
this.provincPolygonList.forEach((item) => item.show(item))
}
}
}
}
</script>
<style scoped lang="scss">
#container {
width: 100%;
height: 53vh;
}
.infoWindow {
display: flex;
flex-direction: column;
font-size: 10px;
.title {
color: #000;
}
.info_item {
display: flex;
justify-content: space-between;
align-items: center;
&:first-child {
span {
color: #444;
}
}
}
}
.amap-info-content {
border-radius: 10px;
}</style>
遇到的问题:
获取地块数据的链接 https://datav.aliyun.com/portal/school/atlas/area_selector
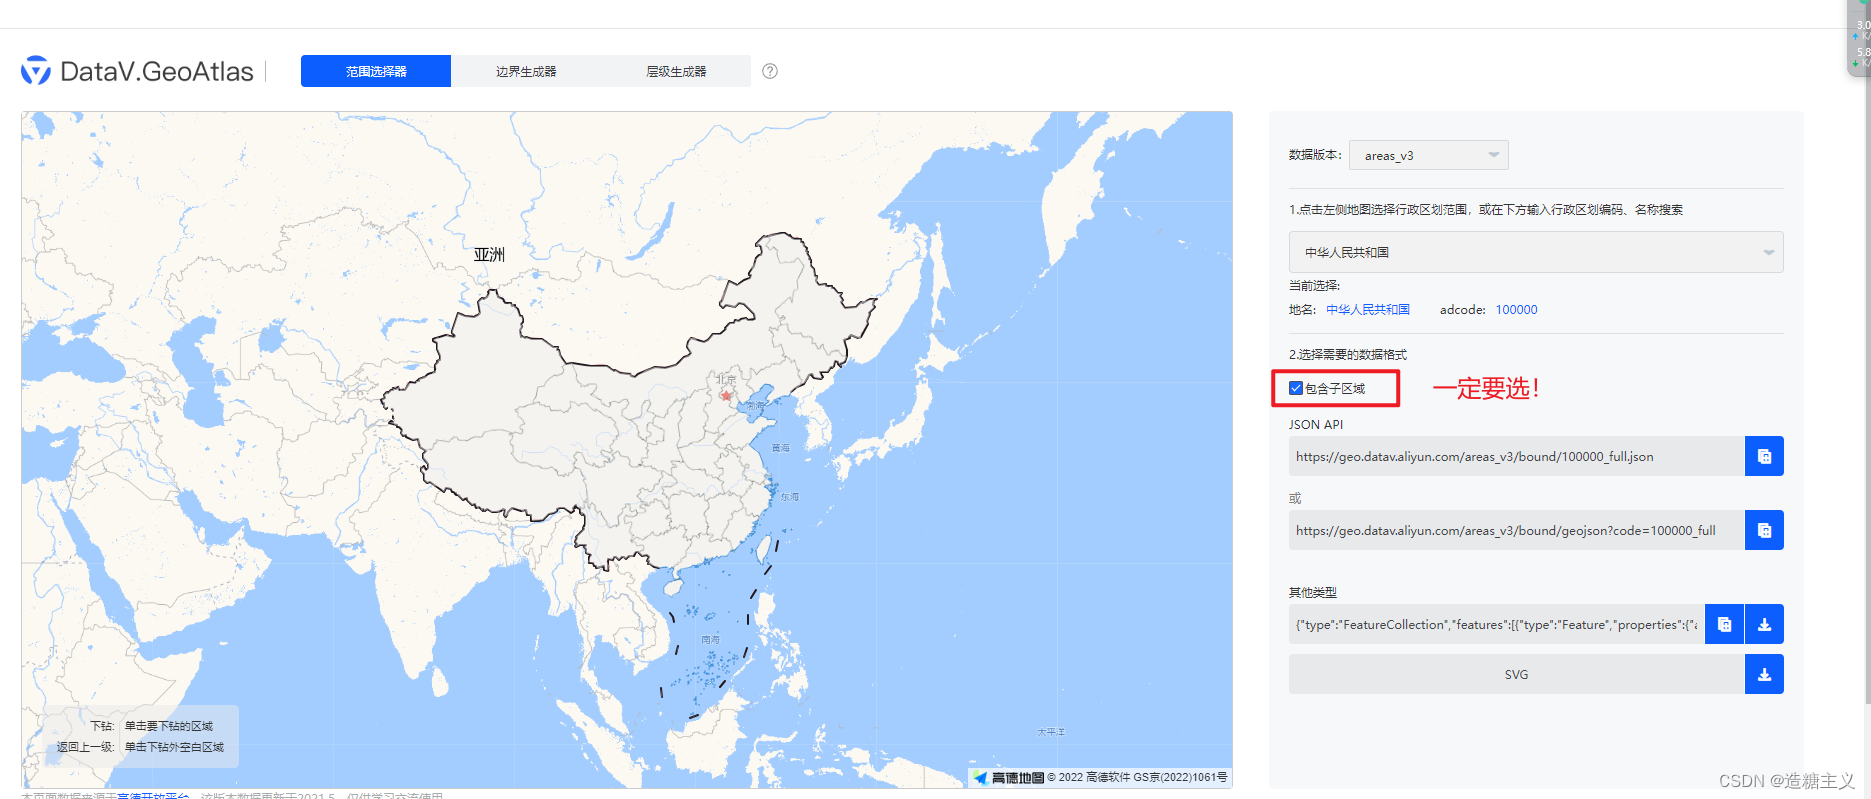
1. 获取到的地块数据不符合全省的各个地块范围
解决方法:构造多边形的地块数据,能够符合地块显示的格式
获取的文件格式
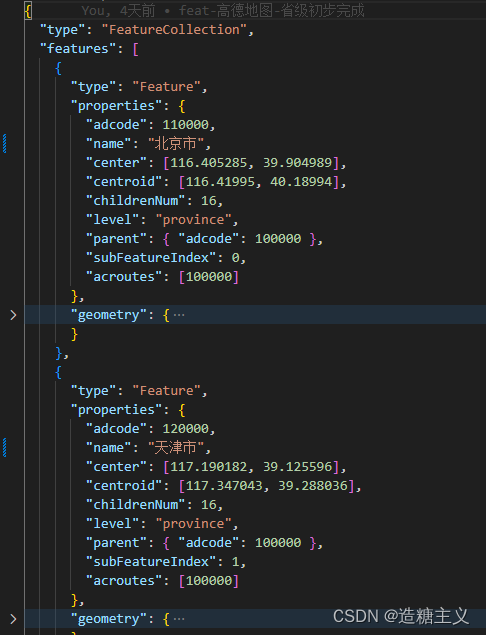
    /**
     * GeoJson数据进行解析
     * @param {*} feature 地块
     * @returns {*} polygonObj 解析的地块
     * @returns {*} markerObj 解析的标记
     */
    addGeoJsonFn(feature) {
      const geoJSON = {
        type: 'FeatureCollection',
        features: [feature]
      }
2. 自定义标记masker样式修改
*解决方法:需要加 /deep/ 才能生效
    // 添加标识
    addMarkerList(center, name, infoObj, level) {
      const markersContent = [
        `<div class='markers_connent'>`,
        `<span class='markers_connent_left' >${name}</span>`,
        `<span class='${level === 'city' ? 'markers_connent_right_city' : 'markers_connent_right'}'>666</span>`,
        `</div>`
      ]
      const marker = new window.AMap.Marker({
        position: center, // 标注点位置
        content: markersContent.join(''),
        map: this.map // 将标注点添加到地图上
      })
      return marker
    },
/deep/ .markers_connent {
  display: flex;
  align-items: center;
  font-size: 10px;
  border-radius: 4px;

  .markers_connent_left {
    color: #666;
    background-color: #fff;
    min-width: 40px;
    height: 20px;
    display: flex;
    align-items: center;
    justify-content: center;
  }
3. 高德地图切换路由后失效
*解决方法:在加载前,将map置空,异步加载绘制方法,离开页面,销毁掉
  async mounted() {
    console.log('加载中')
    this.map = null
    await this.initMap()
      // 初始完地图后,开始绘制
    setTimeout(() => {
      this.setProvinceParcelFn(chinaData.features)
    }, 1000)
  },
  beforeDestroy() { // 离开页面,销毁掉
    this.map && this.map.destroy()
  },
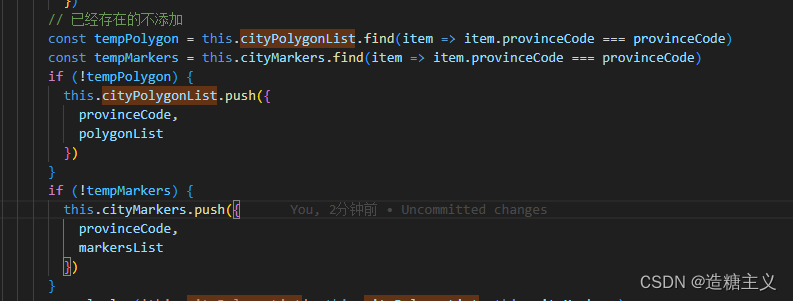
4. 市级图层-需要构造二维数组,优化请求
*解决方法:根据数组中相同的provinceCode来实现是否需要重新加载地块图层
5. 聚合标注图层
*解决方法: 使用高德的覆盖物组 new window.AMap.OverlayGroup() 优化多个marker
const provinceMarkers = new window.AMap.OverlayGroup(this.provinceMarkers)
6. 重复添加覆盖物组无法有效清除
*解决方法: this.map.clearMap() 只能使用这个进行全部清除
- 待优化事项
- 地块图层是否可以设置图层id来实现显示隐藏
- 是否能实现聚合效果