d3.js绘制树形图
这是一篇关于最新版(v7)d3.js如何绘制树形图的介绍,适合有比较扎实js基础的同学阅读
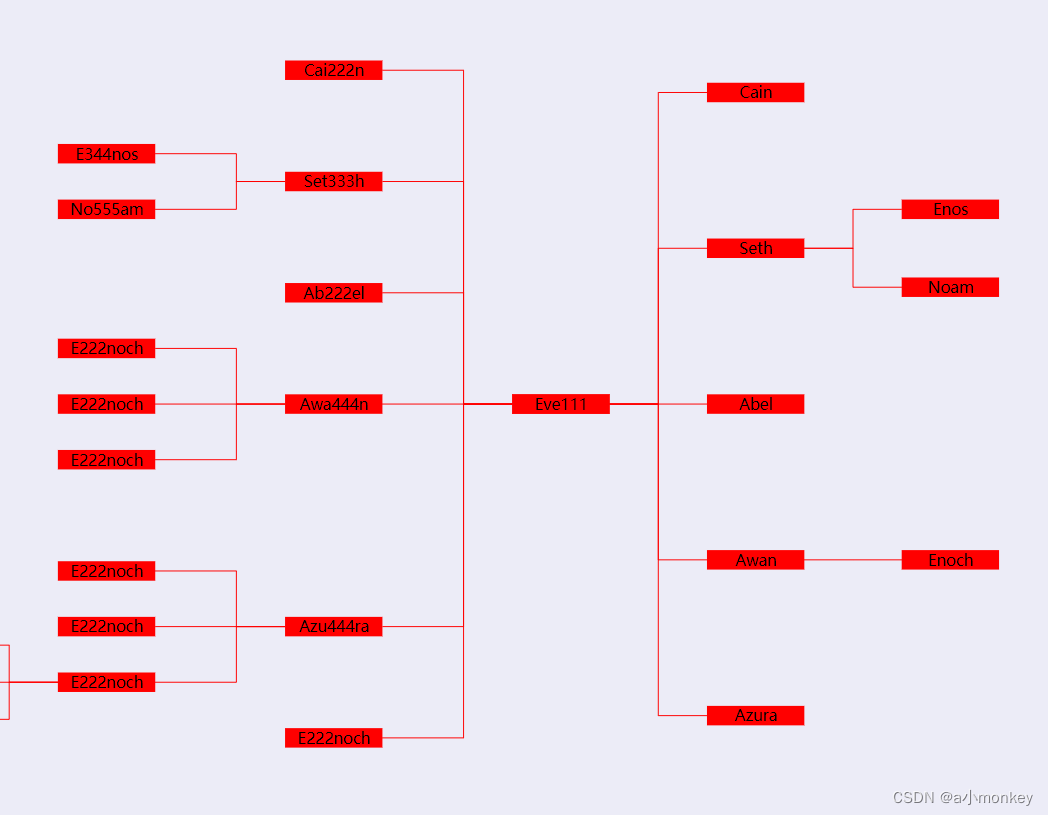
需求是需要绘制一个中心向两边延伸的树形图谱,做之前也在网上查了挺久,但是他喵的查到的全是单边的,并且使用的还是很久之前的版本,甚至有的2021年写的还用的是v3版本,我真是服了,真就一套代码到处复制,一点都不带思考的!!!无奈之下只好自己去研究API了,下面使用的是目前最新版v7版本绘制的,可拖动缩放的树图,简单demo,仅供参考。
主要使用到两个d3提供的方法:
-
d3.hierarchy - constructs a root node from hierarchical data.
-
d3.tree - create a new tidy tree layout.
1. 效果图
2. 上代码(采纳前别忘了给小弟整个赞_)
<!DOCTYPE html>
<html>
  <head>
    <meta http-equiv="Content-Type" content="text/html;charset=utf-8" />
    <title>Node-Link Tree</title>
    <script src="https://d3js.org/d3.v7.min.js"></script>
    <style>
      text {
        pointer-events: none;
      }
    </style>
  </head>

  <body>
    <div id="chart"></div>
    <script>
      const data = {
        name: "Eve",
        children: [
          {
            name: "Cain",
          },
          {
            name: "Seth",
            children: [
              {
                name: "Enos",
              },
              {
                name: "Noam",
              },
            ],
          },
          {
            name: "Abel",
          },
          {
            name: "Awan",
            children: [
              {
                name: "Enoch",
              },
            ],
          },
          {
            name: "Azura",
          },
        ],
      };
      const ldata = {
        name: "Eve111",
        children: [
          {
            name: "Cai222n",
          },
          {
            name: "Set333h",
            children: [
              {
                name: "E344nos",
              },
              {
                name: "No555am",
              },
            ],
          },
          {
            name: "Ab222el",
          },
          {
            name: "Awa444n",
            children: [
              {
                name: "E222noch",
              },
              {
                name: "E222noch",
              },
              {
                name: "E222noch",
              },
            ],
          },
          {
            name: "Azu444ra",
            children: [
              {
                name: "E222noch",
              },
              {
                name: "E222noch",
              },
              {
                name: "E222noch",
                children: [
                  {
                    name: "E222noch",
                  },
                  {
                    name: "E222noch",
                  },
                  {
                    name: "E222noch",
                  },
                ],
              },
            ],
          },
          {
            name: "E222noch",
          },
        ],
      };
      const hierarchy = d3.hierarchy(data);
      const tree = d3
        .tree(data)
        .size([800, 400])
        .separation(function (a, b) {
          return (a.parent == b.parent ? 1 : 2) / a.depth;
        });
      const treeData = tree(hierarchy);

      const hierarchy1 = d3.hierarchy(ldata);
      const tree1 = d3
        .tree(hierarchy1)
        .size([800, 700])
        .separation(function (a, b) {
          return (a.parent == b.parent ? 1 : 2) / a.depth;
        });
      const treeData1 = tree1(hierarchy1);

      const svg = d3
        .select("#chart")
        .append("svg")
        .attr("width", 1200)
        .attr("height", 800)
        .style("background", "#ECECF7");

      const zoomCall = d3.zoom().on("zoom", function (e) {
        console.log(e.transform);
      });
      const zoomG = svg.append("g");
      let translateStr = "";
      let scaleStr = "";
      svg.call(
        d3.zoom().on("zoom", function (e) {
          const { sourceEvent, transform } = e;
          scaleStr = `scale(${transform.k})`;
          translateStr = `translate(${transform.x}px,${transform.y}px)`;
          zoomG.style("transform", `${translateStr} ${scaleStr}`);
        })
      );
      const rightG = zoomG.append("g").style("transform", "translateX(550px)");
      const leftG = zoomG.append("g");


      const lselection = leftG.selectAll("rect").data(treeData1.descendants());
      lselection
        .enter()
        .append("rect")
        .attr("x", (d) => 550 - d.y)
        .attr("y", (d) => d.x - 10)
        .attr("width", "100")
        .attr("height", 20)
        .attr("fill", "red");
      lselection
        .enter()
        .append("text")
        .attr("x", (d) => 550 - d.y + 50)
        .attr("y", (d) => d.x + 6)
        .attr("text-anchor", "middle")
        .text((d) => d.data.name);

      const llinkSel = leftG.selectAll("path").data(treeData1.links());
      // const ge = d3.linkHorizontal().x(d => d.y).y(d => d.x);
      const ge1 = function (data) {
        const { source, target } = data;
        const point = [];
        point.push([source.x + 100, source.y]);
        point.push([source.x + 50, source.y]);
        point.push([source.x + 50, target.y]);
        point.push([target.x, target.y]);
        return "M" + point.join("L");
      };
      llinkSel
        .enter()
        .append("path")
        .attr("d", (d) => {
          const start = {
            y: d.source.x,
            x: 550 - (d.source.y + 100),
          };
          const end = {
            y: d.target.x,
            x: 550 - d.target.y + 100,
          };
          return ge1({
            source: start,
            target: end,
          });
        })
        .attr("fill", "none")
        .attr("stroke", "red")
        .attr("stroke-width", "1");

      const selection = rightG.selectAll("rect").data(treeData.descendants());
      selection
        .enter()
        .append("rect")
        .attr("x", (d) => d.y)
        .attr("y", (d) => d.x - 10)
        .attr("width", "100")
        .attr("height", 20)
        .attr("fill", "red")
        .on("click", (e) => {
          console.log(e);
        });
      selection
        .enter()
        .append("text")
        .attr("x", (d) => d.y + 50)
        .attr("y", (d) => d.x + 6)
        .attr("text-anchor", "middle")
        .text((d) => d.data.name);

      const linkSel = rightG.selectAll("path").data(treeData.links());
      // const ge = d3.linkHorizontal().x(d => d.y).y(d => d.x);
      const ge = function (data) {
        const { source, target } = data;
        const point = [];
        point.push([source.x, source.y]);
        point.push([source.x + 50, source.y]);
        point.push([source.x + 50, target.y]);
        point.push([target.x, target.y]);
        return "M" + point.join("L");
      };
      linkSel
        .enter()
        .append("path")
        .attr("d", (d) => {
          const start = {
            y: d.source.x,
            x: d.source.y + 100,
          };
          const end = {
            y: d.target.x,
            x: d.target.y,
          };
          return ge({
            source: start,
            target: end,
          });
        })
        .attr("fill", "none")
        .attr("stroke", "red")
        .attr("stroke-width", "1");
    </script>
  </body>
</html>
