- 🍨 本文为🔗365天深度学习训练营 中的学习记录博客
- 🍖 原作者:K同学啊
电脑环境:
语言环境:Python 3.8.0
深度学习环境:tensorflow 2.17.0
一、前言
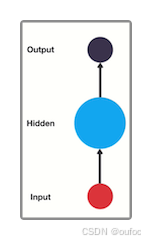
传统神经网络的结构都比较简单:输入层-隐藏层-输出层
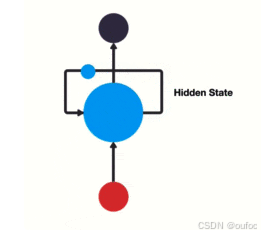
RNN和传统神经网络最大的区别在于每次都会将前一次的输出结果,带到下一次的隐藏层中,一起训练。如下图:
二、代码流程
1、导入包,设置GPU
import tensorflow as tf

gpus = tf.config.list_physical_devices("GPU")

if gpus:
    gpu0 = gpus[0]
    tf.config.experimental.set_memory_growth(gpu0, True)
    tf.config.experimental.set_visible_devices([gpu0], "GPU")

gpus
2、导入数据
数据介绍:
- age: 年龄
- sex: 性别
- cp:胸痛类型 (4 values)
- trestbps: 静息血压
- chol:血清胆甾醇 (mg/ dl
- fbs:空腹血糖 >120 mg/dl
- restecg:静息心电图结果(值 0,1,2)
- thalach:达到的最大心率
- exang:运动诱发的心绞痛
- oldpeak:相对于静止状态,运动引起的ST段压低
- slope: 运动峰值 ST 段的斜率
- ca:荧光透视着色的主要血管数量(0-3)
- thal:0=正常;1=固定缺陷;2=可逆转的缺陷
- target:0=心脏病发作的几率较小1=心脏病发作的几率更大
import pandas as pd
import numpy as np

df = pd.read_csv("heart.csv")
df.head()
3、数据处理
from sklearn.model_selection import train_test_split
from sklearn.preprocessing import StandardScaler

X = df.drop("target", axis=1)
y = df["target"]

X_train, X_test, y_train, y_test = train_test_split(X, y, test_size=0.1, random_state=0)
标准化
scaler = StandardScaler()
X_train = scaler.fit_transform(X_train)
X_test = scaler.transform(X_test)

X_train = X_train.reshape(X_train.shape[0], X_train.shape[1], 1)
X_test = X_test.reshape(X_test.shape[0], X_test.shape[1], 1)
4、构建RNN模型
import tensorflow as tf
from tensorflow.keras.models import Sequential
from tensorflow.keras.layers import LSTM, Dense, SimpleRNN, Dropout

model = Sequential()
model.add(SimpleRNN(200, input_shape=(13, 1), activation="relu"))
model.add(Dense(100, activation="relu"))
model.add(Dense(1, activation='sigmoid'))

model.summary()
5、编译模型
opt = tf.keras.optimizers.Adam(learning_rate=1e-4)
model.compile(optimizer=opt, loss="binary_crossentropy", metrics=["accuracy"])
6、模型训练
epochs = 100

history = model.fit(X_train,
                    y_train,
                    epochs=epochs,
                    batch_size=128,
                    validation_data=(X_test, y_test),
                    verbose=1)
Epoch 1/100
3/3 ━━━━━━━━━━━━━━━━━━━━ 3s 503ms/step - accuracy: 0.5104 - loss: 0.6909 - val_accuracy: 0.6129 - val_loss: 0.6858
..............................................................................................................
Epoch 100/100
3/3 ━━━━━━━━━━━━━━━━━━━━ 0s 15ms/step - accuracy: 0.8956 - loss: 0.2431 - val_accuracy: 0.8710 - val_loss: 0.4132
7、模型评估
import matplotlib.pyplot as plt

acc = history.history['accuracy']
val_acc = history.history['val_accuracy']

loss = history.history['loss']
val_loss = history.history['val_loss']

epochs_range = range(epochs)

plt.figure(figsize=(14, 4))

plt.subplot(1, 2, 1)
plt.plot(epochs_range, acc, label='Training Accuracy')
plt.plot(epochs_range, val_acc, label='Validation Accuracy')
plt.legend(loc='lower right')
plt.title('Training and Validation Accuracy')

plt.subplot(1, 2, 2)
plt.plot(epochs_range, loss, label='Training Loss')
plt.plot(epochs_range, val_loss, label='Validation Loss')
plt.legend(loc='upper right')
plt.title('Training and Validation Loss')
plt.show()


