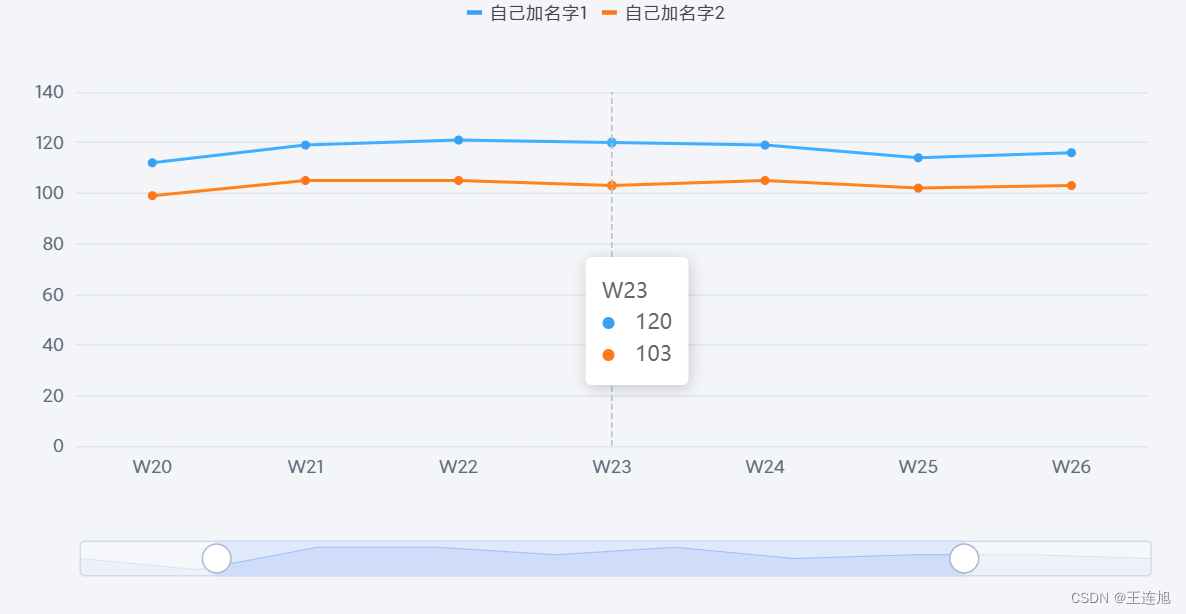
这是一个完整的折线图加拖拽,可以直接复制到页面中使用,有完整代码,效果图。
说明
- ref=“MainOne” 可以说成每个Echarts图标的标识。
- reportData 图标的数据格式
- selfAdaption 浏览器窗口发生变化调用的方法
- EchartsOne 折线图的方法
- legendSvg 自定义的icon图标
- dataZoom 拖拽方法
- fontFamily 字体方法,可能你们用不了
- handleIcon 拖拽的小点点,可以自定义
- stack 要是想用重叠折线图,将这个方法打开,设置成一样的
- formatter 之所以这么写是有原因的,想知道,就把里面的数据换换位置,再看看页面就知道了

自己写的时候可以将 legendSvg / handleIcon 这两个自定义icon 的方法注释,就是到是怎么用的了。
其他的不是我不写注释,是没太大的必要都是一些设置字体、刻度啥的。
<template>
<div class="box">
<div class="main_Echarts_top" ref="MainOne" style="width: 100%"></div>
</div>
</template>
<script>
export default {
data() {
return {
reportData: {
x: ["W19","W20","W21","W22","W23","W24","W25","W26","W27","W28",],
y1: ['120', '112', '119', '121', '120', '119', '114', '116', '120', '118'],
y2: ['102', '99', '105', '105', '103', '105', '102', '103', '103', '102'],
},
};
},
mounted() {
this.EchartsOne(this.reportData);
window.addEventListener("resize", this.selfAdaption);
},
methods: {
selfAdaption() {
let myEchartOne = this.$echarts.init(this.$refs.MainOne);
myEchartOne.resize();
},
EchartsOne(chart_40) {
var myEchart = this.$echarts.init(this.$refs["MainOne"]);
const legendSvg = {
line: "path://M-0.000,-0.000 L10.000,-0.000 L10.000,3.000 L-0.000,3.000 L-0.000,-0.000 Z",
};
var option = {
tooltip: {
trigger: "axis",
formatter: function (params) {
var relVal = params[0].name;
for (var i = 0; i < params.length; i++) {
if (params[i].seriesName == "自己加名字2") {
relVal += `
<div>
<div>
<span style="width: 8px;height: 8px;background: #3AA0F2;
display: inline-block;border-radius: 50%;margin-right: 10px;"></span>
<span style="fontSize:12px;">${params[1].value}</span>
</div>
</div>`;
} else {
relVal += `
<div>
<div>
<span style="width: 8px; height: 8px; background: #FE7718;
display: inline-block; border-radius: 50%;margin-right: 10px;"></span>
<span style="fontSize:12px;">${params[0].value}</span>
</div>
</div>`;
}
}
return relVal;
},
},
legend: {
data: [
{
name: "自己加名字1",
icon: legendSvg.line,
},
{
name: "自己加名字2",
icon: legendSvg.line,
},
],
icon: "line",
itemWidth: 10,
itemHeight: 3,
textStyle: {
color: "#434549",
fontSize: 12,
fontFamily: "Pro_Normal",
fontWeight: "normal",
},
},
grid: {
top: "16%",
left: "3%",
right: "4%",
bottom: "20%",
containLabel: true,
},
toolbox: {
feature: {
},
},
xAxis: {
type: "category",
data: chart_40.x,
nameTextStyle: {
color: "#65ABE7",
fontSize: 12,
},
axisLabel: {
textStyle: {
color: "#5F6A7A",
fontSize: 12,
fontFamily: "Pro_Normal",
fontWeight: "normal",
},
},
axisTick: { show: false },
axisLine: { show: false },
},
yAxis: [
{
type: "value",
axisLabel: {
textStyle: {
color: "#5F6A7A",
fontSize: 12,
fontFamily: "Pro_Normal",
fontWeight: "normal",
},
},
axisTick: { show: false },
axisLine: { show: false },
},
],
dataZoom: {
show: true,
icon: legendSvg.line,
realtime: true,
brushSelect: false,
start: 0,
end: 70,
height: 24,
handleSize: "80%",
handleIcon: "path://M512,512m-448,0a448,448,0,1,0,896,0a448,448,0,1,0,-896,0Z",
backgroundColor: "#F5F7FA",
},
series: [
{
name: "自己加名字2",
type: "line",
stack: "自己加名字2",
symbol: "circle",
symbolSize: 6,
data: chart_40.y2,
lineStyle: {
normal: {
color: "#FE7718",
},
},
itemStyle: {
color: "#FE7718",
},
},
{
name: "自己加名字1",
type: "line",
stack: "自己加名字1",
symbol: "circle",
symbolSize: 6,
data: chart_40.y1,
lineStyle: {
normal: {
color: "#3AA0F2",
},
},
itemStyle: {
color: "#3AA0F2",
},
},
],
};
myEchart.setOption(option);
},
},
};
</script>
<style lang="scss" scoped>
.box{
width: 800px;
height: 400px;
}
.main_Echarts_top{
width: 800px;
height: 400px;
}
</style>
