代码下载链接
import matplotlib. pyplot as plt
import numpy as np
from numpy. random import randn
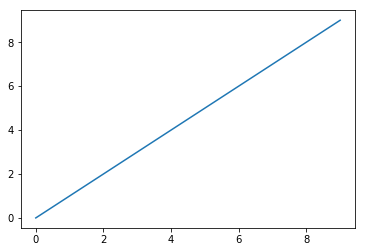
plt. plot( np. arange( 10 ) )
plt. show( )
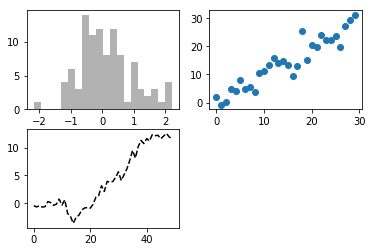
fig= plt. figure( )
ax1= fig. add_subplot( 2 , 2 , 1 )
ax2= fig. add_subplot( 2 , 2 , 2 )
ax3= fig. add_subplot( 2 , 2 , 3 )
plt. plot( np. random. randn( 50 ) . cumsum( ) , 'k--' )
[<matplotlib.lines.Line2D at 0x218cbf11ac8>]
_= ax1. hist( np. random. randn( 100 ) , bins= 20 , color= 'k' , alpha= 0.3 )
ax2. scatter( np. arange( 30 ) , np. arange( 30 ) + 3 * np. random. randn( 30 ) )
plt. show( )
fig, axes= plt. subplots( 2 , 3 )
axes
array([[<matplotlib.axes._subplots.AxesSubplot object at 0x00000218CAB83198>,
        <matplotlib.axes._subplots.AxesSubplot object at 0x00000218CBD430B8>,
        <matplotlib.axes._subplots.AxesSubplot object at 0x00000218CAAB00F0>],
       [<matplotlib.axes._subplots.AxesSubplot object at 0x00000218CBD1E358>,
        <matplotlib.axes._subplots.AxesSubplot object at 0x00000218CBCA96D8>,
        <matplotlib.axes._subplots.AxesSubplot object at 0x00000218CC0934A8>]], dtype=object)
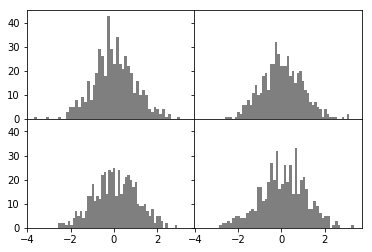
fig, axes= plt. subplots( 2 , 2 , sharex= True , sharey= True )
for i in range ( 2 ) :
for j in range ( 2 ) :
axes[ i, j] . hist( np. random. randn( 500 ) , bins= 50 , color= 'k' , alpha= 0.5 )
plt. subplots_adjust( wspace= 0 , hspace= 0 )
plt. show( )
ax. plot( x, y, 'g--' )
ax. plot( x, y, linestyle= '--' , color= 'g' )
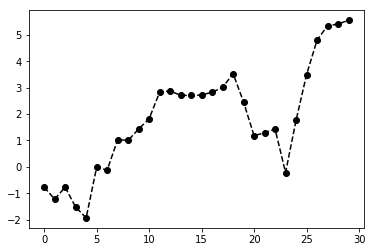
plt. plot( np. random. randn( 30 ) . cumsum( ) , 'ko--' )
plt. show( )
plt. plot( np. random. randn( 30 ) . cumsum( ) , color= 'k' , linestyle= 'dashed' , marker= 'o' )
[<matplotlib.lines.Line2D at 0x156662aff98>]
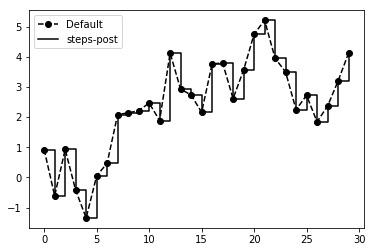
data= np. random. randn( 30 ) . cumsum( )
plt. plot( data, 'ko--' , label= 'Default' )
[<matplotlib.lines.Line2D at 0x1566754bf60>]
plt. plot( data, 'k-' , drawstyle= 'steps-post' , label= 'steps-post' )
plt. legend( loc= 'best' )
plt. show( )
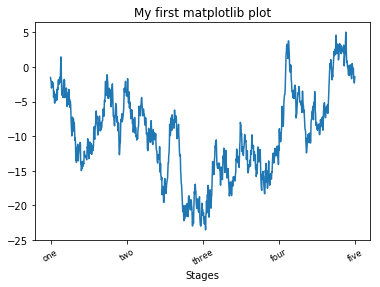
fig= plt. figure( )
ax= fig. add_subplot( 1 , 1 , 1 )
ax. plot( randn( 1000 ) . cumsum( ) )
[<matplotlib.lines.Line2D at 0x15667734400>]
ticks= ax. set_xticks( [ 0 , 250 , 500 , 750 , 1000 ] )
labels= ax. set_xticklabels( [ 'one' , 'two' , 'three' , 'four' , 'five' ] , rotation= 30 , fontsize= 'small' )
ax. set_xlabel( 'Stages' )
ax. set_title( 'My first matplotlib plot' )
plt. show( )
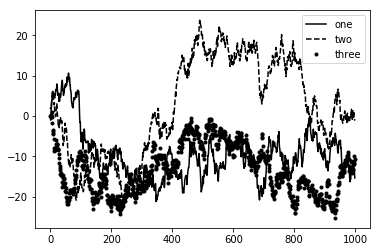
fig= plt. figure( )
ax= fig. add_subplot( 1 , 1 , 1 )
ax. plot( randn( 1000 ) . cumsum( ) , 'k' , label= 'one' )
ax. plot( randn( 1000 ) . cumsum( ) , 'k--' , label= 'two' )
ax. plot( randn( 1000 ) . cumsum( ) , 'k.' , label= 'three' )
ax. legend( loc= 'best' )
plt. show( )
ax. text( x, y, 'Hello world' , family= 'monospace' , fontsize= 10 )
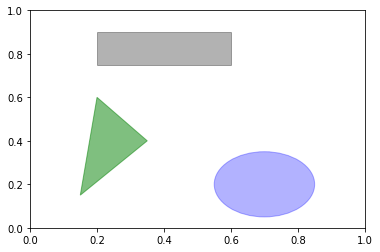
fig= plt. figure( )
ax= fig. add_subplot( 1 , 1 , 1 )
rect= plt. Rectangle( ( 0.2 , 0.75 ) , 0.4 , 0.15 , color= 'k' , alpha= 0.3 )
circ= plt. Circle( ( 0.7 , 0.2 ) , 0.15 , color= 'b' , alpha= 0.3 )
pgon= plt. Polygon( [ [ 0.15 , 0.15 ] , [ 0.35 , 0.4 ] , [ 0.2 , 0.6 ] ] , color= 'g' , alpha= 0.5 )
ax. add_patch( rect)
ax. add_patch( circ)
ax. add_patch( pgon)
plt. show( )
plt. savefig( 'figpath.png' , dpi= 400 , bbox_inches= 'tight' )
from io import StringIO
plt. savefig( buffer )
plot_data= buffer . getvaule( )
plt. rc( 'figure' , figsize= ( 10 , 10 ) )
font_opinions= { 'family' : 'monospace' , 'weight' : 'bold' , 'size' : 'samll' }
plt. rc( 'font' , ** font_options)
提醒,关于这部分内容参考最新的pandas在线文档是最好的学习方式
from pandas import Series, DataFrame
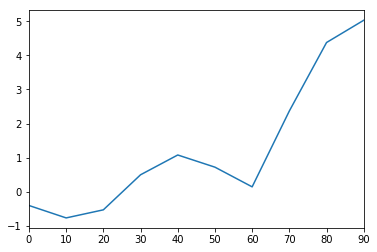
s= Series( randn( 10 ) . cumsum( ) , index= np. arange( 0 , 100 , 10 ) )
s. plot( )
plt. show( )
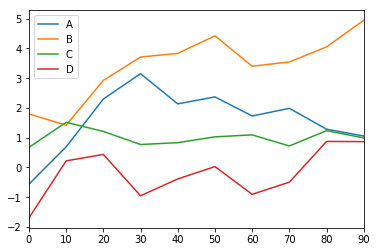
df= DataFrame( randn( 10 , 4 ) . cumsum( 0 ) , columns= [ 'A' , 'B' , 'C' , 'D' ] , index= np. arange( 0 , 100 , 10 ) )
df. plot( )
plt. show( )
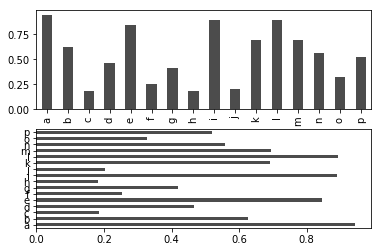
在生成线型图的代码中加上kind=‘bar’(垂直柱状图)或kind=’barh’(水平柱状图)即可生成柱状图,这时,Series和DataFrame的索引会被用作X(bar)或Y(barh)刻度
fig, axes= plt. subplots( 2 , 1 )
data= Series( np. random. rand( 16 ) , index= list ( 'abcdefghijklmnop' ) )
data. plot( kind= 'bar' , ax= axes[ 0 ] , color= 'k' , alpha= 0.7 )
data. plot( kind= 'barh' , ax= axes[ 1 ] , color= 'k' , alpha= 0.7 )
plt. show( )
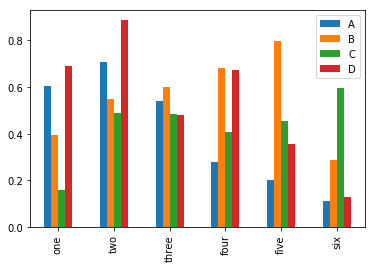
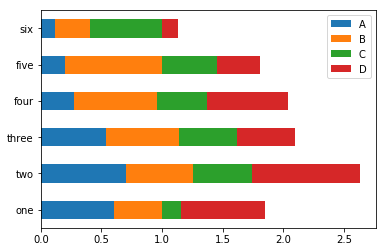
df= DataFrame( np. random. rand( 6 , 4 ) , index= [ 'one' , 'two' , 'three' , 'four' , 'five' , 'six' ] , columns= [ 'A' , 'B' , 'C' , 'D' ] )
df
A B C D one 0.605969 0.392503 0.159506 0.689187 two 0.706356 0.548750 0.489465 0.886399 three 0.539584 0.598980 0.482615 0.478261 four 0.277114 0.683394 0.407497 0.671090 five 0.201349 0.797898 0.454740 0.355270 six 0.113781 0.288068 0.597394 0.130346
df. plot( kind= 'bar' )
plt. show( )
df. plot( kind= 'barh' , stacked= True )
plt. show( )
import pandas as pd
tips= pd. read_csv( 'ch08/tips.csv' )
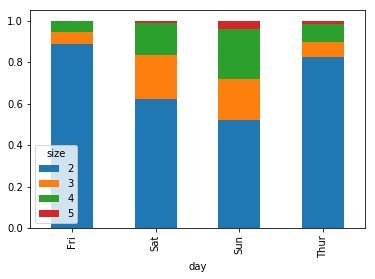
party_counts= pd. crosstab( tips. day, tips[ 'size' ] )
party_counts
size 1 2 3 4 5 6 day Fri 1 16 1 1 0 0 Sat 2 53 18 13 1 0 Sun 0 39 15 18 3 1 Thur 1 48 4 5 1 3
party_counts= party_counts. ix[ : , 2 : 5 ]
party_pcts= party_counts. div( party_counts. sum ( 1 ) . astype( float ) , axis= 0 )
party_pcts
size 2 3 4 5 day Fri 0.888889 0.055556 0.055556 0.000000 Sat 0.623529 0.211765 0.152941 0.011765 Sun 0.520000 0.200000 0.240000 0.040000 Thur 0.827586 0.068966 0.086207 0.017241
party_pcts. plot( kind= 'bar' , stacked= True )
plt. show( )
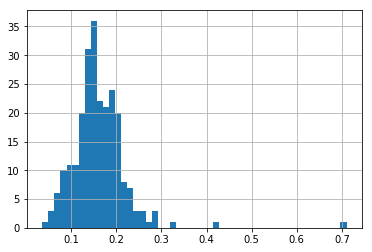
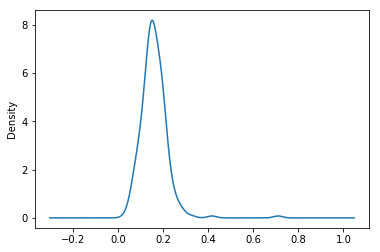
tips[ 'tip_pct' ] = tips[ 'tip' ] / tips[ 'total_bill' ]
tips[ 'tip_pct' ] . hist( bins= 50 )
plt. show( )
tips[ 'tip_pct' ] . plot( kind= 'kde' )
plt. show( )
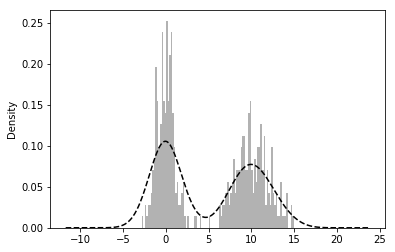
comp1= np. random. normal( 0 , 1 , size= 200 )
comp2= np. random. normal( 10 , 2 , size= 200 )
values= Series( np. concatenate( [ comp1, comp2] ) )
values. hist( bins= 100 , alpha= 0.3 , color= 'k' , normed= True )
values. plot( kind= 'kde' , style= 'k--' )
plt. show( )
scatterplot观察两个一维数组序列之间关系的有效手段
macro= pd. read_csv( 'ch08/macrodata.csv' )
data= macro[ [ 'cpi' , 'm1' , 'tbilrate' , 'unemp' ] ]
trans_data= np. log( data) . diff( ) . dropna( )
trans_data[ - 5 : ]
cpi m1 tbilrate unemp 198 -0.007904 0.045361 -0.396881 0.105361 199 -0.021979 0.066753 -2.277267 0.139762 200 0.002340 0.010286 0.606136 0.160343 201 0.008419 0.037461 -0.200671 0.127339 202 0.008894 0.012202 -0.405465 0.042560
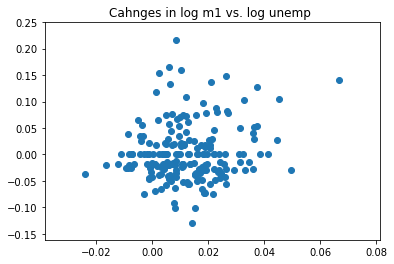
plt. scatter( trans_data[ 'm1' ] , trans_data[ 'unemp' ] )
plt. title( 'Cahnges in log %s vs. log %s ' % ( 'm1' , 'unemp' ) )
plt. show( )
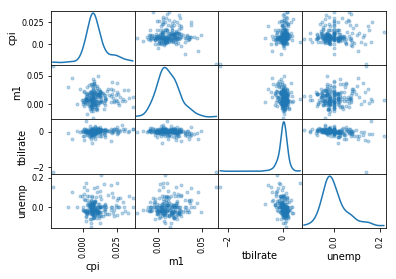
pd. scatter_matrix( trans_data, diagonal= 'kde' , alpha= 0.3 )
plt. show( )
import pandas as pd
data= pd. read_csv( 'ch08/Haiti.csv' )
data. head( )
Serial INCIDENT TITLE INCIDENT DATE LOCATION DESCRIPTION CATEGORY LATITUDE LONGITUDE APPROVED VERIFIED 0 4052 * URGENT * Type O blood donations needed in #J... 05/07/2010 17:26 Jacmel, Haiti Birthing Clinic in Jacmel #Haiti urgently need... 1. Urgences | Emergency, 3. Public Health, 18.233333 -72.533333 YES NO 1 4051 Food-Aid sent to Fondwa, Haiti 28/06/2010 23:06 fondwa Please help food-aid.org deliver more food to ... 1. Urgences | Emergency, 2. Urgences logistiqu... 50.226029 5.729886 NO NO 2 4050 how haiti is right now and how it was during t... 24/06/2010 16:21 centrie i feel so bad for you i know i am supposed to ... 2. Urgences logistiques | Vital Lines, 8. Autr... 22.278381 114.174287 NO NO 3 4049 Lost person 20/06/2010 21:59 Genoca We are family members of Juan Antonio Zuniga O... 1. Urgences | Emergency, 44.407062 8.933989 NO NO 4 4042 Citi Soleil school 18/05/2010 16:26 Citi Soleil, Haiti We are working with Haitian (NGO) -The Christi... 1. Urgences | Emergency, 18.571084 -72.334671 YES NO
data[ [ 'INCIDENT DATE' , 'LATITUDE' , 'LONGITUDE' ] ] [ : 10 ]
INCIDENT DATE LATITUDE LONGITUDE 0 05/07/2010 17:26 18.233333 -72.533333 1 28/06/2010 23:06 50.226029 5.729886 2 24/06/2010 16:21 22.278381 114.174287 3 20/06/2010 21:59 44.407062 8.933989 4 18/05/2010 16:26 18.571084 -72.334671 5 26/04/2010 13:14 18.593707 -72.310079 6 26/04/2010 14:19 18.482800 -73.638800 7 26/04/2010 14:27 18.415000 -73.195000 8 15/03/2010 10:58 18.517443 -72.236841 9 15/03/2010 11:00 18.547790 -72.410010
data[ 'CATEGORY' ] [ : 6 ]
0          1. Urgences | Emergency, 3. Public Health,
1    1. Urgences | Emergency, 2. Urgences logistiqu...
2    2. Urgences logistiques | Vital Lines, 8. Autr...
3                            1. Urgences | Emergency,
4                            1. Urgences | Emergency,
5                       5e. Communication lines down,
Name: CATEGORY, dtype: object
data. describe( )
Serial LATITUDE LONGITUDE count 3593.000000 3593.000000 3593.000000 mean 2080.277484 18.611495 -72.322680 std 1171.100360 0.738572 3.650776 min 4.000000 18.041313 -74.452757 25% 1074.000000 18.524070 -72.417500 50% 2163.000000 18.539269 -72.335000 75% 3088.000000 18.561820 -72.293570 max 4052.000000 50.226029 114.174287
data= data[ ( data. LATITUDE> 18 ) & ( data. LATITUDE< 20 ) & ( data. LONGITUDE> - 75 )
& ( data. LONGITUDE< - 70 ) & ( data. CATEGORY. notnull( ) ) ]
def to_cat_list ( catstr) :
stripped= ( x. strip( ) for x in catstr. split( ',' ) )
return [ x for x in stripped if x]
def get_all_categories ( cat_series) :
cat_sets= ( set ( to_cat_list( x) ) for x in cat_series)
return sorted ( set . union( * cat_sets) )
def get_english ( cat) :
code, names= cat. split( '.' )
if '|' in names:
names= names. split( '|' ) [ 1 ]
return code, names. strip( )
get_english( '2. Urgences logistique |Vital Lines' )
('2', 'Vital Lines')
all_cats= get_all_categories( data. CATEGORY)
english_mapping= dict ( get_english( x) for x in all_cats)
english_mapping[ '2a' ]
'Food Shortage'
english_mapping[ '6c' ]
'Earthquake and aftershocks'
from pandas import DataFrame
def get_code ( seq) :
return [ x. split( '.' ) [ 0 ] for x in seq if x]
all_codes= get_code( all_cats)
code_index= pd. Index( np. unique( all_codes) )
dummy_frame= DataFrame( np. zeros( ( len ( data) , len ( code_index) ) ) , index= data. index, columns= code_index)
dummy_frame. head( )
1 1a 1b 1c 1d 2 2a 2b 2c 2d ... 7c 7d 7g 7h 8 8a 8c 8d 8e 8f 0 0.0 0.0 0.0 0.0 0.0 0.0 0.0 0.0 0.0 0.0 ... 0.0 0.0 0.0 0.0 0.0 0.0 0.0 0.0 0.0 0.0 4 0.0 0.0 0.0 0.0 0.0 0.0 0.0 0.0 0.0 0.0 ... 0.0 0.0 0.0 0.0 0.0 0.0 0.0 0.0 0.0 0.0 5 0.0 0.0 0.0 0.0 0.0 0.0 0.0 0.0 0.0 0.0 ... 0.0 0.0 0.0 0.0 0.0 0.0 0.0 0.0 0.0 0.0 6 0.0 0.0 0.0 0.0 0.0 0.0 0.0 0.0 0.0 0.0 ... 0.0 0.0 0.0 0.0 0.0 0.0 0.0 0.0 0.0 0.0 7 0.0 0.0 0.0 0.0 0.0 0.0 0.0 0.0 0.0 0.0 ... 0.0 0.0 0.0 0.0 0.0 0.0 0.0 0.0 0.0 0.0
5 rows × 45 columns
for row, cat in zip ( data. index, data. CATEGORY) :
codes= get_code( to_cat_list( cat) )
dummy_frame. ix[ row] [ codes] = 1
data= data. join( dummy_frame. add_prefix( 'category_' ) )
data. head( )
Serial INCIDENT TITLE INCIDENT DATE LOCATION DESCRIPTION CATEGORY LATITUDE LONGITUDE APPROVED VERIFIED ... category_7c category_7d category_7g category_7h category_8 category_8a category_8c category_8d category_8e category_8f 0 4052 * URGENT * Type O blood donations needed in #J... 05/07/2010 17:26 Jacmel, Haiti Birthing Clinic in Jacmel #Haiti urgently need... 1. Urgences | Emergency, 3. Public Health, 18.233333 -72.533333 YES NO ... 0.0 0.0 0.0 0.0 0.0 0.0 0.0 0.0 0.0 0.0 4 4042 Citi Soleil school 18/05/2010 16:26 Citi Soleil, Haiti We are working with Haitian (NGO) -The Christi... 1. Urgences | Emergency, 18.571084 -72.334671 YES NO ... 0.0 0.0 0.0 0.0 0.0 0.0 0.0 0.0 0.0 0.0 5 4041 Radio Commerce in Sarthe 26/04/2010 13:14 Radio Commerce Shelter, Sarthe i'm Louinel from Sarthe. I'd to know what can ... 5e. Communication lines down, 18.593707 -72.310079 YES NO ... 0.0 0.0 0.0 0.0 0.0 0.0 0.0 0.0 0.0 0.0 6 4040 Contaminated water in Baraderes. 26/04/2010 14:19 Marc near Baraderes How do we treat water in areas without Pipe?\t... 4. Menaces | Security Threats, 4e. Assainissem... 18.482800 -73.638800 YES NO ... 0.0 0.0 0.0 0.0 0.0 0.0 0.0 0.0 0.0 0.0 7 4039 Violence at "arcahaie bas Saint-Ard" 26/04/2010 14:27 unable to find "arcahaie bas Saint-Ard&qu... Goodnight at (arcahaie bas Saint-Ard) 2 young ... 4. Menaces | Security Threats, 18.415000 -73.195000 YES NO ... 0.0 0.0 0.0 0.0 0.0 0.0 0.0 0.0 0.0 0.0
5 rows × 55 columns
from mpl_toolkits. basemap import Basemap
def basic_haiti_map ( ax= None , lllat= 17.25 , urlat= 20.25 , lllon= - 75.0 , urlon= - 71.0 ) :
m= Basemap( ax= ax, projection= 'stere' , lon_0= ( urlon+ lllon) / 2 ,
lat_0= ( urlat+ lllat) / 2 , llcrnrlat= lllat,
urcrnrlat= urlat, llcrnrlon= lllon, urcrnrlon= urlon, resolution= 'f' )
m. drawcoastlines( )
m. drawstates( )
m. drawcounties( )
return m
fig, axes= plt. subplots( nrows= 2 , ncols= 2 , figsize= ( 12 , 10 ) )
fig. subplots_adjust( hspace= 0.05 , wspace= 0.05 )
to_plot= [ '2a' , '1' , '3c' , '7a' ]
lllat= 17.25
urlat= 20.25
lllon= - 75
urlon= - 71
for code, ax in zip ( to_plot, axes. flat) :
m= basic_haiti_map( ax, lllat= lllat, urlat= urlat, lllon= lllon, urlon= urlon)
cat_data= data[ data[ 'category_%s' % code] == 1 ]
x, y= m( list ( cat_data. LONGITUDE) , list ( cat_data. LATITUDE) )
m. plot( x, y, 'k.' , alpha= 0.5 )
ax. set_title( '%s:%s' % ( code, english_mapping[ code] ) )
plt. show( )
最后的地图由于软件原因没有显示出来,读者可以参考原书的相关章节
