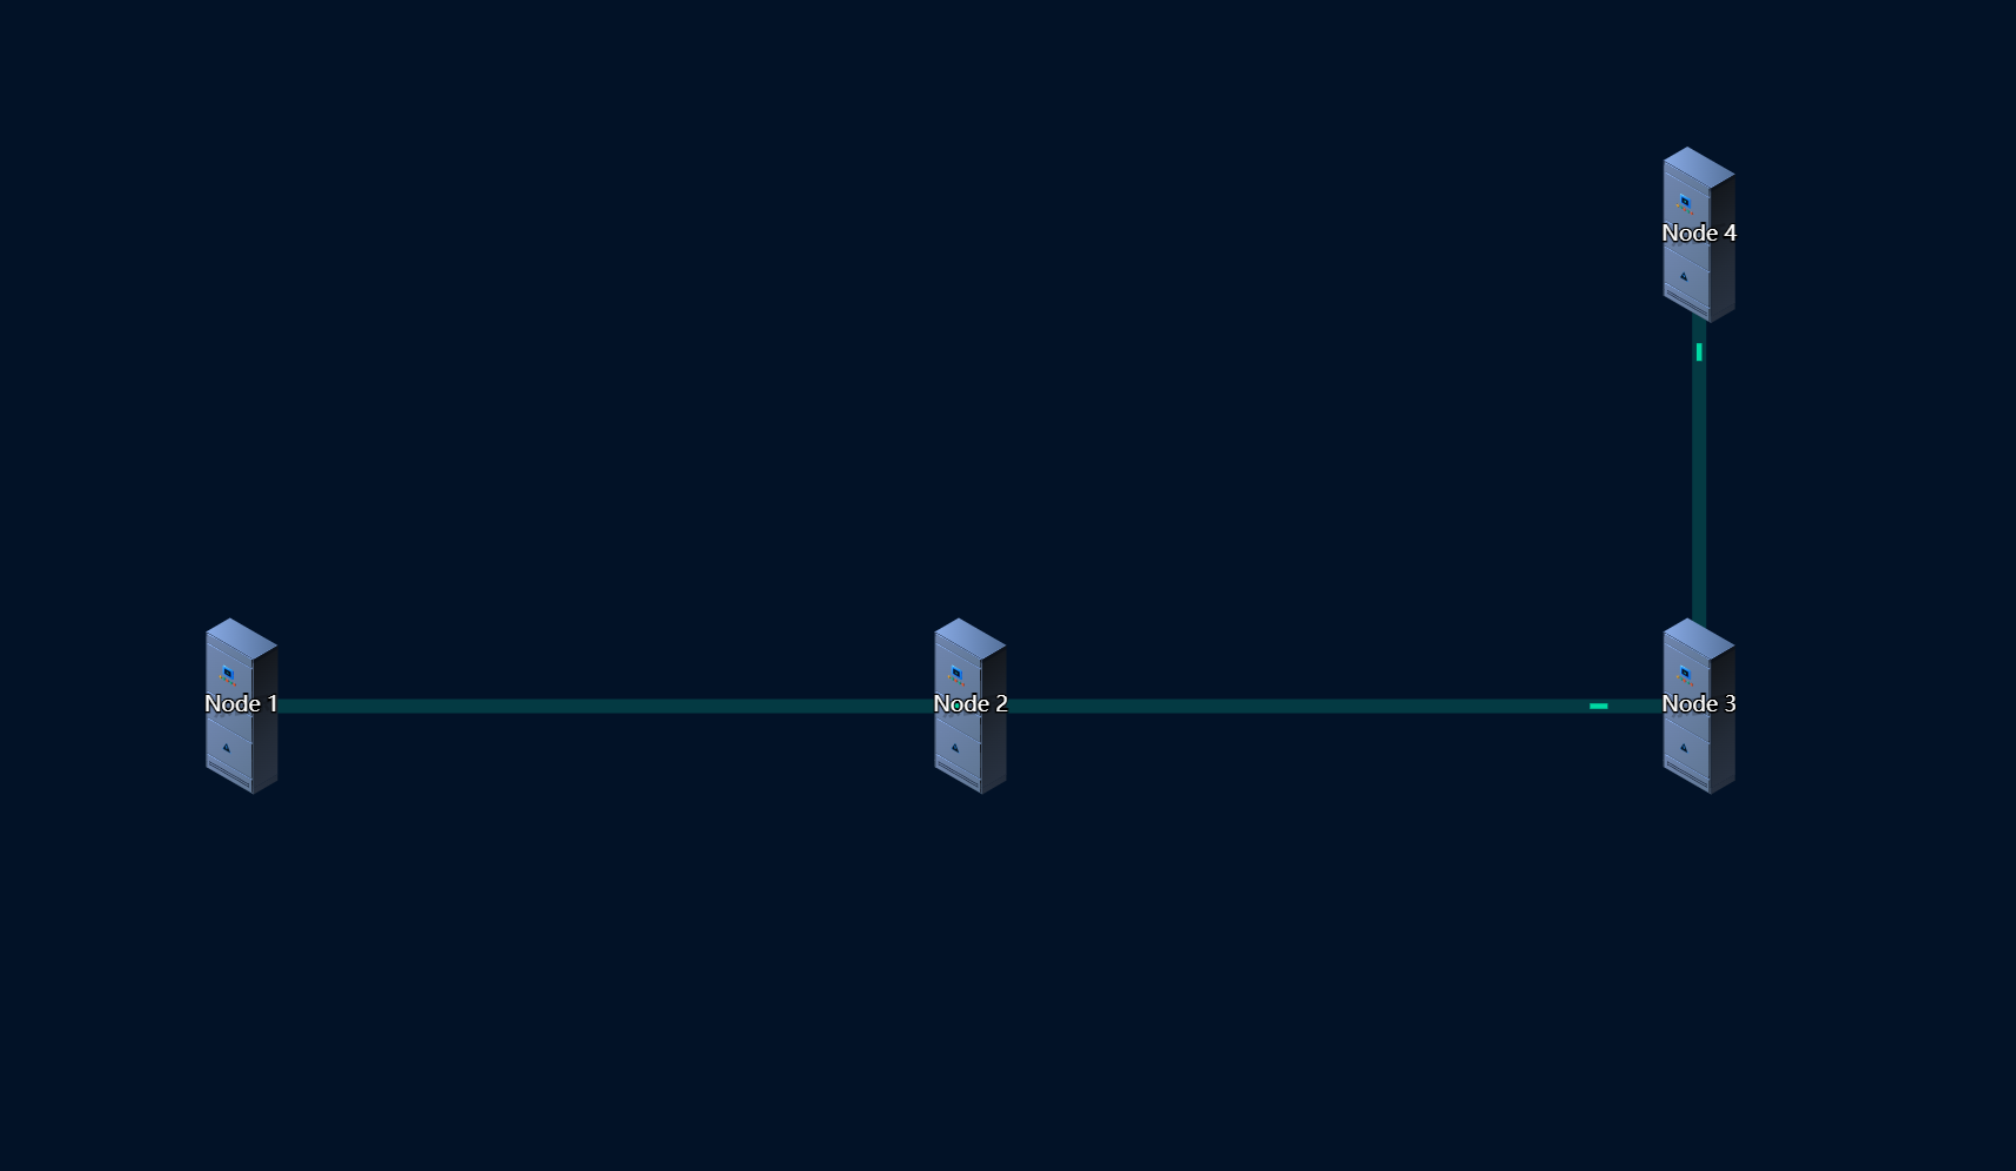
目的
要实现一个由几条线串起来的设备,线是动态的,如下
相关技术
vue,echarts
难点
因为用到了两种图,要保持坐标系一致性,graph设置coordinateSystem: ‘cartesian2d’,后不能使用x,y要使用value,(这一点官网没有说)
代码
<script setup>
import { ref } from 'vue'
import MyEcharts from '@/components/myEcharts/index.vue'
import symbol_img_1 from '../../assets/image/test/配电柜.svg'

const opt = ref(null)
opt.value = {
  title: {
    text: '巡检图'
  },
  xAxis: {
    show: false,
    type: 'value',
    min: 0,
    max: 100
  },
  yAxis: {
    show: false,
    type: 'value',
    min: 0,
    max: 100
  },
  tooltip: {},
  animationDurationUpdate: 1500, // 数据更新动画的时长,单位 ms,默认 300
  animationEasingUpdate: 'quinticInOut', // 数据更新动画的缓动效果,默认 'cubicOut'
  series: [
    {
      type: 'graph',
      coordinateSystem: 'cartesian2d',
      layout: 'none', // 图的布局 none:不采用任何布局
      symbol: `image://${symbol_img_1}`, // 节点标记的图形
      symbolSize: 100, // 节点大小,可以设置数组表示宽高
      roam: false, // 是否可以平移缩放
      label: {
        show: true //是否显示标签
      },
      edgeSymbol: ['circle', 'arrow'], // 边两端的类型
      edgeSymbolSize: [4, 10], // 边两端的大小,可以设置数组表示宽高

      edgeLabel: {
        // 边的文本标签
        fontSize: 20
      },
      data: [
        {
          name: 'Node 1',
          value: [20, 50]
        },
        {
          name: 'Node 2',
          value: [50, 50]
        },
        {
          name: 'Node 3',
          value: [80, 50]
        },
        {
          name: 'Node 4',
          value: [80, 80]
        }
      ],
      links: [
        // {
        //   source: 'Node 1',
        //   target: 'Node 2',
        //   symbolSize: [10, 20],
        //   label: {
        //     show: false
        //   },
        //   lineStyle: {
        //     width: 5,
        //     color: 'rgba(15, 117, 148, 1)',
        //     type: 'dashed',
        //     dashOffset: 5, // 虚线偏移量
        //     curveness: 0 // 0-1 之间的数值,表示曲度,值越大曲度越大
        //   }
        // }
      ]
    },
    {
      type: 'lines',
      polyline: true, // 是否为多线段
      coordinateSystem: 'cartesian2d', // 坐标系类型

      lineStyle: {
        type: 'solid',
        width: 8,
        color: 'rgba(5, 98, 96, 1)'
      },
      effect: {
        period: 3, // 动画时间
        show: true,
        trailLength: 0, // 尾迹长度
        symbol: 'rect',
        color: 'rgba(0, 217,163, 1)',
        loop: true,
        symbolSize: [3, 10]
      },
      data: [
        {
          coords: [
            [20, 50],
            [50, 50]
          ]
        },
        {
          coords: [
            [50, 50],
            [80, 50]
          ]
        },
        {
          coords: [
            [80, 50],
            [80, 80]
          ]
        }
      ]
    }
  ]
}
</script>
