在做基础实验的时候,研究者都希望能够改变各种条件来进行对比分析,从而探索自己所感兴趣的方向。
在做数据分析的时候也是一样的,我们希望有一个数据集能够附加了很多临床信息/表型,然后二次分析者们就可以进一步挖掘。
然而现实情况总是数据集质量非常不错,但是附加的临床信息/表型却十分有限,这种状况在单细胞数据分析中更加常见。
因此如何将大量的含有临床信息/表型的bulk RNA测序数据和单细胞数据构成联系,这也是算法开发者们所重点关注的方向之一。
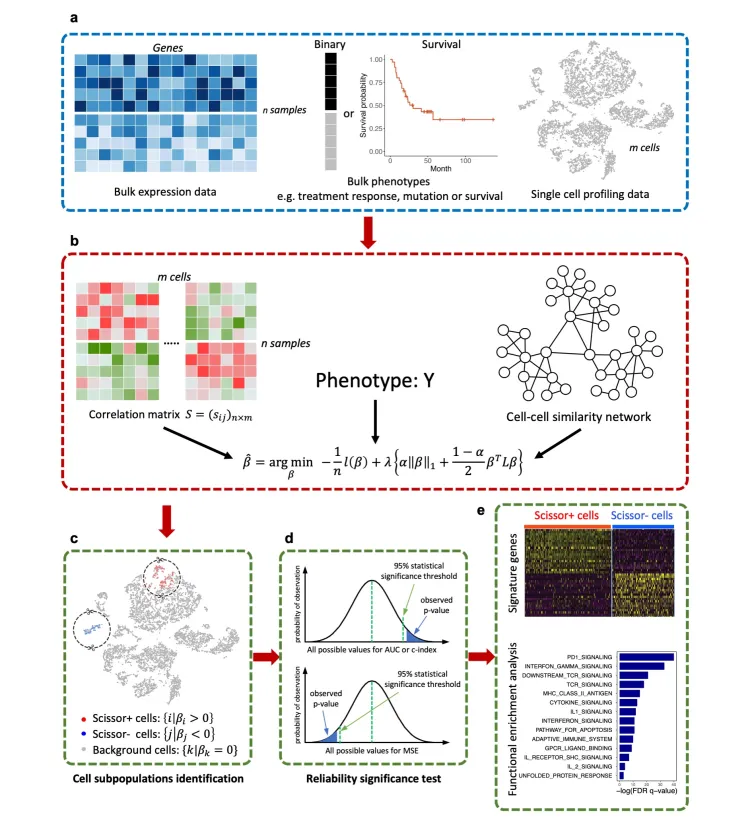
其中Scissor算法就可以从含有表型的bulk RNA数据中提取信息去鉴别单细胞亚群。
Scissor的分析原理主要是:
基于表达数据计算每个单细胞与bulk样本的相关性,筛选相关性较好的细胞群。
进一步结合表型信息,通过回归模型并加上惩罚项选出最相关的亚群。
原理详情可见:
1、github: https://github.com/sunduanchen/Scissor?tab=readme-ov-file
2、生信技能树教程1:https://mp.weixin.qq.com/s/jC6QTQCfcl_i4tTbFQAq7A
3、生信技能树教程2:https://mp.weixin.qq.com/s/dIYDNDPgIEDUkqqSr56GPg
分析步骤如下:
很多教程展示的是跟生存数据相关的分析,我这里采用二分类数据进行分析。
并且该算法最新一次更新是2021年,如果是使用seruat5版本构建单细胞数据集的话会报错,在进行分析前需要提取Scissor源代码修改一下。
1、导入数据和加载R包
rm(list = ls())
library(Scissor)
library(seurat)
scRNA <- readRDS("scRNA_tumor.rds") #这里采用了自己的处理的单细胞数据
load("step1output.Rdata") #这里也是自己处理的bulkRNA数据
sc_dataset <- scRNA
#dim(sc_dataset)
#[1] 20124  5042
bulk_dataset <- exp
#        GSM1310570 GSM1310571 GSM1310572 GSM1310573
#FAM174B      8.232      8.248      7.576      8.708
#AP3S2        5.998      6.079      5.695      6.653
#SV2B         6.107      6.630      5.686      7.886
#RBPMS2       6.718      7.630      7.410      5.762
phenotype <- pd
#                   title doubling time (days) survival time(months) gender doubling_group OS_group
#GSM1310570 Tumor T_A_001                  119                    52 female              1        0
#GSM1310571 Tumor T_B_003                   98                    44   male              0        0
#GSM1310572 Tumor T_C_005                   50                     3   male              0        0
#GSM1310573 Tumor T_D_007                   80                    28   male              0        1
#GSM1310574 Tumor T_E_009                  197                    47   male              1        0
#GSM1310575 Tumor T_F_011                  297                    52 female              1        0
我这里对OS和double时间进行了分组,变成了二分类数据。后面会单独提取。
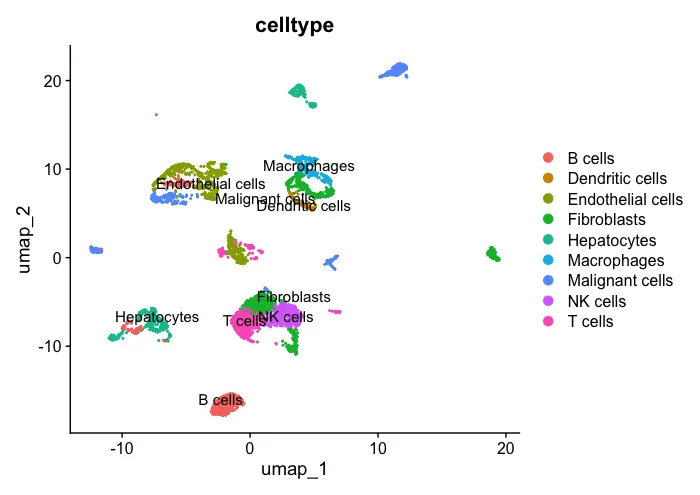
2、先看一下处理好的分群结果
# Check
UMAP_celltype <- DimPlot(sc_dataset, reduction ="umap",
                         group.by="celltype",label = T)
UMAP_celltype
3、运行Scissor,生存数据family设置"cox" ,logistic回归family设置"binomial"。
其中二分类变量在分析前需要设置tag
#提取想要的数据信息
colnames(phenotype)
phenotype <- phenotype[,"doubling_group"]
tag <- c("Quick","Slow")

#分析时数据中不能存在na数据,去除或者改成0
#bulk_dataset <- na.omit(bulk_dataset)
bulk_dataset[is.na(bulk_dataset)] <- 0

#正式开始分析
infos1 <- Scissor(bulk_dataset, sc_dataset, phenotype,
                     tag = tag,
                     alpha = 0.02, # 默认0.05
                     cutoff = 0.2, #the number of the Scissor selected cells should not exceed 20% of total cells in the single-cell data
                     family = "binomial",
                     Save_file = './result.RData')
# Error in as.matrix(sc_dataset@assays$RNA@data) :
# no slot of name "data" for this object of class "Assay5"
Error in as.matrix(sc_dataset@assays$RNA@data) : no slot of name "data" for this object of class "Assay5"
看来这个算法暂不直接适用于seraut5版本,没办法只能提取原代码进行稍作修改,把读取单细胞数据data部分的代码内容增加layer即可,新的代码保存之后再调用。
4、修改之后的代码,命名为RUNscissor
其实就是修改了里边的读取方式:sc_exprs <- as.matrix(sc_dataset@assaysdata)
RUNScissor <- function (bulk_dataset, sc_dataset, phenotype, tag = NULL, alpha = NULL,
                        cutoff = 0.2, family = c("gaussian", "binomial", "cox"),
                        Save_file = "Scissor_inputs.RData", Load_file = NULL)
{
  library(Seurat)
  library(Matrix)
  library(preprocessCore)

  # 确保 phenotype 是向量
  phenotype <- as.numeric(phenotype)

  if (is.null(Load_file)) {
    common <- intersect(rownames(bulk_dataset), rownames(sc_dataset))
    if (length(common) == 0) {
      stop("There is no common genes between the given single-cell and bulk samples.")
    }

    if (class(sc_dataset) == "Seurat") {
      sc_exprs <- as.matrix(sc_dataset@assays$RNA@layers$data)
      rownames(sc_exprs) <- rownames(sc_dataset)
      colnames(sc_exprs) <- colnames(sc_dataset)
      network <- as.matrix(sc_dataset@graphs$RNA_snn)
    } else {
      sc_exprs <- as.matrix(sc_dataset)
      Seurat_tmp <- CreateSeuratObject(sc_dataset)
      Seurat_tmp <- FindVariableFeatures(Seurat_tmp, selection.method = "vst", verbose = FALSE)
      Seurat_tmp <- ScaleData(Seurat_tmp, verbose = FALSE)
      Seurat_tmp <- RunPCA(Seurat_tmp, features = VariableFeatures(Seurat_tmp), verbose = FALSE)
      Seurat_tmp <- FindNeighbors(Seurat_tmp, dims = 1:10, verbose = FALSE)
      network <- as.matrix(Seurat_tmp@graphs$RNA_snn)
    }

    diag(network) <- 0
    network[which(network != 0)] <- 1
    dataset0 <- cbind(bulk_dataset[common, ], sc_exprs[common, ])
    dataset0 <- as.matrix(dataset0)
    dataset1 <- normalize.quantiles(dataset0)
    rownames(dataset1) <- rownames(dataset0)
    colnames(dataset1) <- colnames(dataset0)
    Expression_bulk <- dataset1[, 1:ncol(bulk_dataset)]
    Expression_cell <- dataset1[, (ncol(bulk_dataset) + 1):ncol(dataset1)]
    X <- cor(Expression_bulk, Expression_cell)

    quality_check <- quantile(X)
    print("|**************************************************|")
    print("Performing quality-check for the correlations")
    print("The five-number summary of correlations:")
    print(quality_check)
    print("|**************************************************|")

    if (quality_check[3] < 0.01) {
      warning("The median correlation between the single-cell and bulk samples is relatively low.")
    }

    if (family == "binomial") {
      Y <- as.numeric(phenotype)
      z <- table(Y)
      if (length(z) != length(tag)) {
        stop("The length differs between tags and phenotypes. Please check Scissor inputs and selected regression type.")
      } else {
        print(sprintf("Current phenotype contains %d %s and %d %s samples.", z[1], tag[1], z[2], tag[2]))
        print("Perform logistic regression on the given phenotypes:")
      }
    }

    if (family == "gaussian") {
      Y <- as.numeric(phenotype)
      z <- table(Y)
      if (length(z) != length(tag)) {
        stop("The length differs between tags and phenotypes. Please check Scissor inputs and selected regression type.")
      } else {
        tmp <- paste(z, tag)
        print(paste0("Current phenotype contains ", paste(tmp[1:(length(z) - 1)], collapse = ", "), ", and ", tmp[length(z)], " samples."))
        print("Perform linear regression on the given phenotypes:")
      }
    }

    if (family == "cox") {
      Y <- as.matrix(phenotype)
      if (ncol(Y) != 2) {
        stop("The size of survival data is wrong. Please check Scissor inputs and selected regression type.")
      } else {
        print("Perform cox regression on the given clinical outcomes:")
      }
    }

    save(X, Y, network, Expression_bulk, Expression_cell, file = Save_file)
  } else {
    load(Load_file)
  }

  if (is.null(alpha)) {
    alpha <- c(0.005, 0.01, 0.05, 0.1, 0.2, 0.3, 0.4, 0.5, 0.6, 0.7, 0.8, 0.9)
  }

  for (i in 1:length(alpha)) {
    set.seed(123)
    fit0 <- APML1(X, Y, family = family, penalty = "Net", alpha = alpha[i], Omega = network, nlambda = 100, nfolds = min(10, nrow(X)))
    fit1 <- APML1(X, Y, family = family, penalty = "Net", alpha = alpha[i], Omega = network, lambda = fit0$lambda.min)

    if (family == "binomial") {
      Coefs <- as.numeric(fit1$Beta[2:(ncol(X) + 1)])
    } else {
      Coefs <- as.numeric(fit1$Beta)
    }

    Cell1 <- colnames(X)[which(Coefs > 0)]
    Cell2 <- colnames(X)[which(Coefs < 0)]
    percentage <- (length(Cell1) + length(Cell2)) / ncol(X)
    print(sprintf("alpha = %s", alpha[i]))
    print(sprintf("Scissor identified %d Scissor+ cells and %d Scissor- cells.", length(Cell1), length(Cell2)))
    print(sprintf("The percentage of selected cell is: %s%%", formatC(percentage * 100, format = "f", digits = 3)))

    if (percentage < cutoff) {
      break
    }
    cat("\n")
  }

  print("|**************************************************|")
  return(list(para = list(alpha = alpha[i], lambda = fit0$lambda.min, family = family), Coefs = Coefs, Scissor_pos = Cell1, Scissor_neg = Cell2))
}
5、运行RUNScissor
source("~/Desktop/practice/5-Scissor/RUNScissor.R")
infos1 <- RUNScissor(bulk_dataset, sc_dataset, phenotype,
                     tag = tag,
                     alpha = 0.02, # 默认0.05
                     cutoff = 0.2, #the number of the Scissor selected cells should not exceed 20% of total cells in the single-cell data
                     family = "binomial",
                     Save_file = './doubling_time.RData')

#[1] "|**************************************************|"
#[1] "Performing quality-check for the correlations"
#[1] "The five-number summary of correlations:"
#        0%        25%        50%        75%       100%
#0.03017724 0.29070054 0.32966267 0.37428284 0.70446959
#[1] "|**************************************************|"
#[1] "Current phenotype contains 38 Quick and 43 Slow samples."
#[1] "Perform logistic regression on the given phenotypes:"
#[1] "alpha = 0.02"
#[1] "Scissor identified 202 Scissor+ cells and 690 Scissor- cells."
#[1] "The percentage of selected cell is: 17.691%"
#[1] "|**************************************************|"
Scissor算法首先给出不同比例细胞下单细胞和bulkRNA数据之间的相关性值,如果相关性过低(< 0.01),则会给出warning信息。
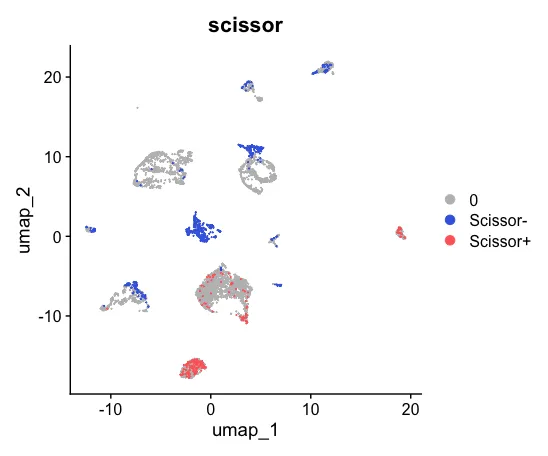
此外,表型分组分别为 38例Quick 样本和 43 例Slow样本,数据采用了logistic回归分析,alpha设置为0.02,共获得了202 Scissor+ 细胞和690 Scissor- 细胞。这里的Scissor+ 细胞是指Slow组样本,一般默认表型信息设置为0和1,0代表未发生感兴趣事件,1代表发生了感兴趣事件,在设置tag信息时需要跟表型信息顺序对应起来。
值得重点关注的是这里的alpha和cutoff值。cutoff值则代表所选择细胞的百分比,默认是小于0.2(20%)。Alpha值平衡了 L1范数和网络惩罚的影响,Alpha值越大则惩罚力度也越大从而得到的scissor+/-细胞数也就越少。通常我们应当保证不超过cutoff的范围下,去自定义alpha值。
6、可视化
Scissor_select <- rep(0, ncol(sc_dataset))
names(Scissor_select) <- colnames(sc_dataset)
Scissor_select[infos1$Scissor_pos] <- "Scissor+"
Scissor_select[infos1$Scissor_neg] <- "Scissor-"
sc_dataset <- AddMetaData(sc_dataset,
                          metadata = Scissor_select,
                          col.name = "scissor")
UMAP_scissor <- DimPlot(sc_dataset, reduction = 'umap',
                        group.by = 'scissor',
                        cols = c('grey','royalblue','indianred1'),
                        pt.size = 0.001, order = c("Scissor+","Scissor-"))
UMAP_scissor
table(sc_dataset$scissor)
patchwork::wrap_plots(plots = list(UMAP_celltype,UMAP_scissor), ncol = 2)
saveRDS(sc_dataset,"sc_dataset.rds")
然后可以对两张图片进行对比。
致谢:感谢曾老师,小洁老师以及生信技能树团队全体成员。
注:若对内容有疑惑或者有发现明确错误的朋友,请联系后台(希望多多交流)。更多内容可关注公众号:生信方舟
- END -


