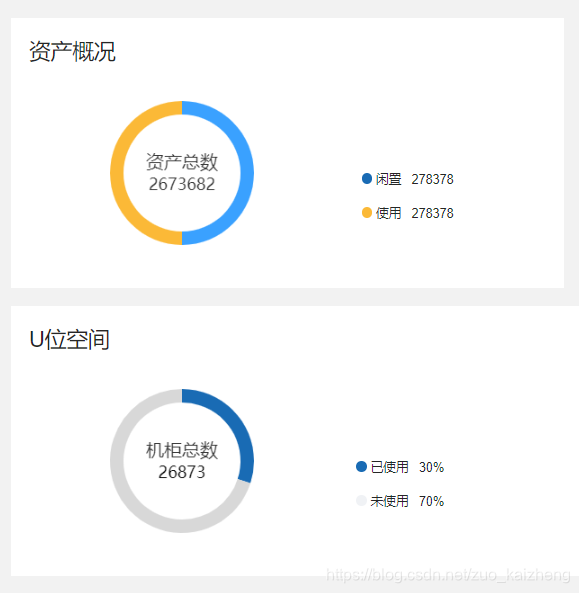
Echarts 的饼图中间添加文字说明 ,主要使用graphic、title来完成配置,效果图如下:
html部分代码
<div class="asset-item">
<p class="home-header-title">资产概况</p>
<div class="home-header-echart">
<div id="echart1" style="width: 200px;height: 200px;display: inline-block;"></div> //图表
<div class="echart-content">
<div class="xz">
<div>
<span class="blue-dot"></span>
<span>闲置 278378</span>
</div>
<div>
<span class="orange-dot"></span>
<span>使用 278378</span>
</div>
</div>
</div>
</div>
</div>
js代码部分
<script type="text/javascript">
				// 基于准备好的dom,初始化echarts实例
				var myChart = echarts.init(document.getElementById('echart1'));
				// 指定图表的配置项和数据
				var option = {
					tooltip: {
					                trigger: 'item',
					                formatter: "{a} <br/>{b}: {c} ({d}%)"
					            },
					color: ["#3aa1ff", "#fbb937"],
					title: {
						text: "2673682",
						left: "center",
						top: "50%",
						textStyle: {
							textAlign: "center",
							fill: "#333",
							fontSize: 18,
							fontWeight: 400,
						}
					},
					graphic: {
						type: "text",
						left: "center",
						top: "40%",
						style: {
							text: "资产总数",
							textAlign: "center",
							fill: "#333",
							fontSize: 20,
						}
					},
					series: [{
						name: '资产总数',
						type: 'pie',
						radius: ['65%', '80%'],
						avoidLabelOverlap: false,
						 // hoverAnimation: false,
						label: {
							normal: {
								show: false,
								position: 'center'
							},

						},

						data: [{
								value: 50,
								name: '闲置'
							},
							{
								value: 50,
								name: '使用'
							},

						]
					}]
				};

				// 使用刚指定的配置项和数据显示图表。
				myChart.setOption(option);
			</script>
