1.graph
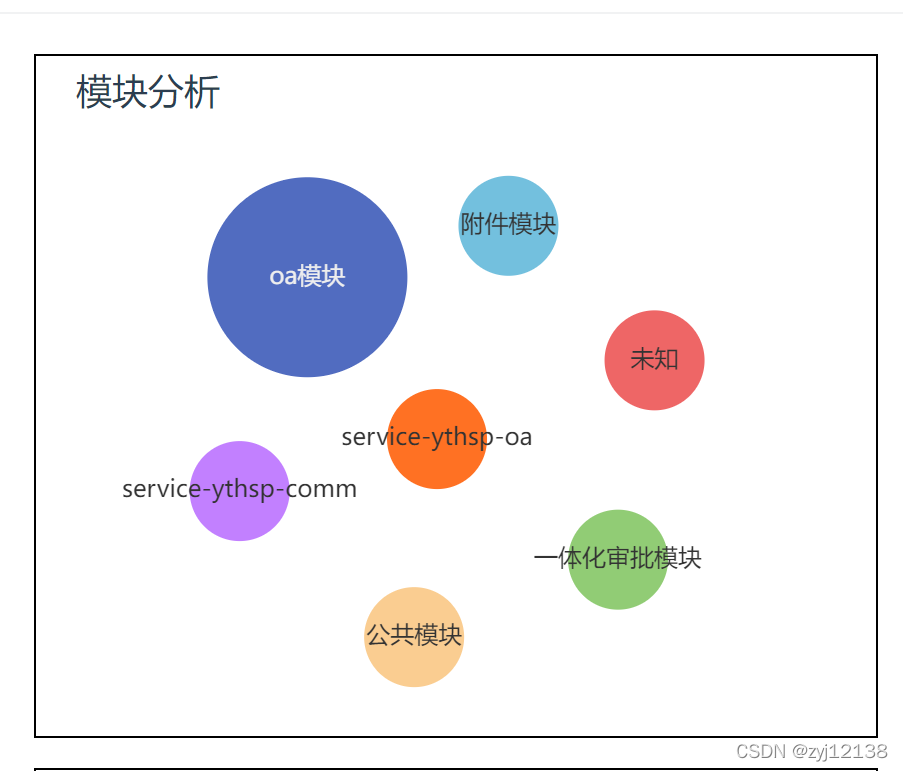
graph相对scatter不会出现重叠的问题,自己写的scatter相对而言比较失败(出现重叠问题)所以决定写graph图
<template>
    <div class="chart" ref="buble"></div>
</template>

<script>
export default {

    name: 'bubleChart',
    props: {

        chartData: {

            type: Array,
            required: true,
        },
    },
    data() {

        return {

            chart: null,
        }
    },
    mounted() {

        this.$nextTick(() => {

            this.initChart()
        })
    },
    watch: {

        /* 如果图表数据是后台获取的,监听父组件中的数据变化,重新触发Echarts */
        chartData: {

            deep: true,
            handler(val) {

                this.setOptions(val)
            },
        },
    },
    beforeDestroy() {

        if (!this.chart) {

            return
        }
        /* 释放图表实例 */
        this.chart.dispose()
        /* dispose 会释放内部占用的一些资源和事件绑定,但是解除实例的引用我们是做不到的,所以需要重新赋值为null */
        this.chart = null
    },
    methods: {

        initChart() {

            this.chart = this.$echarts.init(this.$refs.buble)
            this.setOptions(this.chartData)
        },
        setOptions(data = []) {

            let [maxValue, temp] = [0, []]
            data.forEach((item) => {

                temp.push(item.value)
            })
            maxValue = Math.max.apply(null, temp)
            // 气泡颜色数组
            const color = ['#FAC858', '#FACD91', '#516CC0', '#EE6666', '